Texas new home sales up 3.5% in May, but year outlook dims
HomesUSA.com reports higher prices as pending and active sales flatten
/EIN News/ -- DALLAS, June 20, 2024 (GLOBE NEWSWIRE) -- Texas new home sales were up 3.5% last month, but the latest data is dimming the outlook for the rest of the year, according to the newest monthly Texas New Home Sales Report released today by HomesUSA.com and its founder and CEO, Ben Caballero, the nation's top-ranked real estate agent.
The HomesUSA.com New Home Sales Report uses Multiple Listing Service data – the most comprehensive, current, and accurate information – from the Realtor Associations of North Texas, Houston, Austin, and San Antonio.
According to the statewide May MLS data, the 3-month average of new home sales in Texas was 3.5% higher than in April as Dallas-Ft. Worth, Houston, Austin, and San Antonio combined posted a 3-month average of 6,106 sales versus 5,899 sales in April. All four major new home sales markets posted higher sales.
Despite being the first time this year that more than 6,000 total sales were posted in a single month, Caballero worries about signals “dimming the prospects” as new home inventory continues to build.
“While new home sales were slightly higher in May, their moderate seasonal strength does not bode well for the rest of 2024,” said Caballero, America's No. 1-ranked real estate agent and CEO and founder of HomesUSA.com, explaining, “Pending sales numbers – an indicator of future sales – are flat and are confirming my concern.”
The 3-month average of statewide pending new home sales for May totaled 7,081 versus 7,083 in April.
“Moreover, active listings of new homes are up almost 14% year-over-year in May as Texas builders struggle to move inventory in the face of higher interest rates,” Caballero notes. May inventory was nearly unchanged from the previous month, as the 3-month average active listings inventory in Texas’ four major new home markets was 29,979 versus 29,495 in April.
“Texas builders are working hard to reduce that inventory,” Caballero said. “With pending and active sales stalling last month, new home sales long-term outlook would be worse if it were not for the underlying strength of our Texas economy,” he added.
In Dallas-Ft. Worth, May new home sales totaled 1,986 versus 1,892 in April. Houston’s May’s sales were 2,093 versus 2,036, Austin’s May sales totaled 955 versus 917, and San Antonio’s May sales were 1,073 versus 1,054.
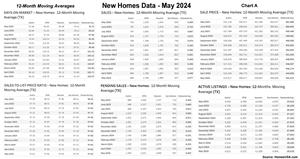
Per seasonal activity, the HomesUSA.com New Home Sales Index’s 3-month average for Days on Market remains relatively steady, showing a reduction overall among the four leading Texas new home sales markets. Dallas-Ft. Worth, Houston, Austin, and San Antonio reported an overall 3-month average for Days on Market in May of 109.66 days versus 112.25 days in April.
Texas spring home buyers paid more for a new home in May as the average 3-month price was up in Dallas-Ft. Worth, Houston and San Antonio, while slightly lower in Austin. The four largest new home markets combined posted an average sales price in May of $442,676 versus $436,083 in April.
May’s average new home sales price exceeded April’s in Dallas-Ft. Worth at $486,197 versus $475,516, Houston at $411,767 versus $405,602, and San Antonio at $353,388 versus $348,830, while Austin's average 3-month price was the only market with a slightly lower average price of $520,281 versus $522,799 in April.
HomesUSA.com is sharing its New Home Sales Report and New Home Sales Index before the Commerce Department releases its nationwide New Residential Sales Report for May, set for Wednesday, June 26, 2024, at 10:00 am Eastern time.
The HomesUSA.com monthly report covers closed sales recorded in MLSs by the 10th day of the following month. Sales reported by agents after the 10th of the month are not included. The report features 3-month and 12-month moving averages for six essential market data, including Days on Market, sales volume, sales prices, a sales-to-list price ratio, pending sales, and active listings. Caballero explained the 3-month moving average indices track market seasonality, while the 12-month moving average removes the seasonality and tracks the longer trend.
Days on Market Remain Steady – New Homes in Texas (Exclusive Data)
The HomesUSA.com New Home Sales Index showed the 3-month moving average of Days on Market (DOM) in May remained steady in Texas’ four major new home markets. In Dallas-Ft. Worth, the DOM decreased to 134.84 days versus 142.24 days in April. Houston’s DOM was 98.15 days versus 97.98 days in April. In Austin, the DOM dropped to 93.96 days versus 101.31 days in April. In San Antonio, the DOM was 99.28 days versus 95.90 days in April. New homes have significantly higher Days on Market or DOM than existing homes because most are listed while under construction. (See Chart 1: Texas New Homes Days on Market)
Texas New Home Sales Tick Higher
Based on all local MLS data, the most reliable and current source of all home sales activity, total new home sales were higher in all four of Texas' largest new home markets last month. The May 3-month moving average of new home sales in Dallas-Ft. Worth was 1,986 versus 1,892 in April. In Houston, May’s total sales were higher at 2,093 versus 2,036 in April. Austin's new home sales last month were also higher at 955 versus 917 in April. In San Antonio, new home sales in May were 1,073 versus 1,054 in April. (See Chart 2: Texas New Home Sales)
Texas New Home Prices Steadily Increase
The average prices of new homes increased in three of the four major new home markets in Texas last month. In Dallas-Ft. Worth, the 3-month moving average price for new homes in May was $486,197 versus $475,516 in April. In Houston, the average new home price in May was $411,767 versus $405,602 in April. San Antonio's average new home price was also higher in May at $353,388 versus $348,830 in April. Austin was the exception, as the 3-month moving average price decreased in May to $520,281 versus $522,799 in April. (See Chart 3: Texas New Home Prices)
Texas Sales-to-List Price Ratio Remain Stable
Cumulative new home sales remain slightly lower than 100 percent of the asking price. The combined 3-month moving average of the sales-to-list price ratio in Texas’ four largest markets for May was 97.60 versus 97.69 percent a year ago and 97.35 percent in April this year. Dallas-Ft. Worth’s ratio in May was 97.91 versus 97.84 percent last May and 97.72 percent in April this year. In Houston, the ratio in May was 96.91 versus 97.78 percent last May and 96.62 percent in April this year. In Austin, the sales-to-price ratio in May was 97.88 versus 97.12 percent last May and 97.77 percent in April this year. San Antonio's ratio in May was 98.13 versus 97.73 percent a year ago and 97.75 in April this year. (See Chart 4: Texas Sales-to-List Price Ratio)
Texas Pending New Homes Sales Flatten
Based on local MLS data, the average 3-month pending new home sales flattened last month in the four largest Texas new home markets. The combined four-market average in May totaled 7,081 versus 7,083 in April. In Dallas-Ft. Worth, pending new home sales last month were 2,489 versus 2,497 in April. In Houston, pending new home sales in May were 2,188 versus 2,176 in April. In Austin, pending new home sales in May were 1,370 versus 1,399 in April. In San Antonio, pending new home sales last month were 1,033 versus 1,012 in April. (See Chart 5: Texas Pending New Home Sales)
Texas Active Listings for New Homes Remain Flat
Active new home listings remain flat overall despite slight increases in the four largest Texas new home markets in May. The May 3-month average active listings inventory in Texas’ four major new home markets was 29,979 new homes versus 29,495 in April. Dallas-Ft. Worth's active listings in May increased to 6,832 versus 6,650 in April. Active listings in Houston last month also increased to 12,424 versus 12,247 in April. In Austin, active listings in May were higher at 5,789 versus 5,701 in April. In San Antonio, active listings last month were 4,934 versus 4,896 in April. (See Chart 6: Texas Active Listings)
About the HomesUSA.com New Home Sales Index
The HomesUSA.com Index is reported as both a 3-month and 12-month moving average of the Days on Market (DOM) for new homes listed in the local Multiple Listing Services (MLSs) for Dallas-Ft. Worth, Houston, Austin, and San Antonio. Created by Ben Caballero, it is the first Days on Market index to track the Texas new home market and includes homes listed while under construction. (See Chart A: 12-Month Moving Averages)
*Note: Texas data denotes a combination of its four largest new home markets – Houston, Dallas-Ft. Worth, Austin, and San Antonio – which comprise the vast majority of new home sales and MLS data statewide.
About Ben Caballero and HomesUSA.com®
Ben Caballero, founder and CEO of HomesUSA.com, is a three-time Guinness World Records title holder for ‘Most annual home sale transactions through MLS by an individual sell-side real estate agent – current.’ Ranked by REAL Trends as America’s top real estate agent for home sales since 2013, Ben is the most productive real estate agent in U.S. history. He is the only individual real estate agent to exceed $3 billion in residential sales transactions in a single year (2022), the first agent to exceed $2 billion (2018, 2019, 2020), and the first agent to exceed $1 billion (2015, 2016, 2017). Ben, an award-winning innovator and technology pioneer, works with more than 60 home builders in Dallas-Fort Worth, Houston, Austin, and San Antonio. His podcast series is available on iTunes and Google Podcasts. Learn more at HomesUSA.com |Twitter: @bcaballero - @HomesUSA | Facebook: /HomesUSAdotcom.
Note for journalists: You may contact Ben Caballero directly by email at ben@homesusa.com.
REALTOR® is a federally registered collective membership mark which identifies a real estate professional who is a member of the NATIONAL ASSOCIATION OF REALTORS® and subscribes to its strict Code of Ethics.
Media Contact:
Kevin Hawkins
(206) 866-1220
kevin@wavgroup.com
Image: Ben Caballero (2023)
https://homesusa.com/wp-content/uploads/2023/04/Ben_Caballero_1-scaled.jpg
Individual Chart images:
Chart 1: Texas New Homes Tracking – Days on Market – May 2024: https://homesusa.com/wp-content/uploads/2024/06/Chart-1-Texas-New-Homes-Tracking-Days-on-Market.jpg
Chart 2: Texas New Home Sales Market – May 2024: https://homesusa.com/wp-content/uploads/2024/06/Chart-2-Texas-New-Home-Sales-Market.jpg
Chart 3: Texas New Home Sales Prices Market – May 2024: https://homesusa.com/wp-content/uploads/2024/06/Chart-3-Texas-New-Home-Sales-Prices-Market.jpg
Chart 4: Texas Sales-to-List-Price Ratio Market – May 2024: https://homesusa.com/wp-content/uploads/2024/06/Chart-4-Texas-Sales-to-List-Price-Ratio-Market.jpg
Chart 5: Texas Pending New Home Sales Market – May 2024: https://homesusa.com/wp-content/uploads/2024/06/Chart-5-Texas-Pending-New-Home-Sales-Market.jpg
Chart 6: Texas Active Listings for New Home Market – May 2024: https://homesusa.com/wp-content/uploads/2024/06/Chart-6-Texas-Active-Listings-for-New-Homes-Market.jpg
Chart A: Texas 12-Month Moving Averages Market – May 2024: https://homesusa.com/wp-content/uploads/2024/06/Chart-A-12MonthChart-DataOnly.jpg

![]()
Ben Caballero, founder and CEO of HomesUSA.com

Ben Caballero, founder and CEO of HomesUSA.com, is a three-time Guinness World Records title holder for "Most annual home sale transactions through MLS by an individual sell-side real estate agent." Ranked by RealTrends/HousingWire as America's top real estate agent for home sales since 2013, Ben is the most productive real estate agent in US history. He is the first real estate agent to eclipse $1 billion, then $2 billion (several times), and most recently over $3 billion in total home sales in a single year by an individual agent (twice).
Chart 1: Texas New Homes Tracking – Days on Market – May 2024
The HomesUSA.com New Home Sales Index’s 3-month average for Days on Market remains relatively steady, showing a reduction overall among the four leading Texas new home sales markets. Dallas-Ft. Worth, Houston, Austin, and San Antonio reported an overall 3-month average for Days on Market in May of 109.66 days versus 112.25 days in April.
Chart 2: Texas New Home Sales Market – May 2024
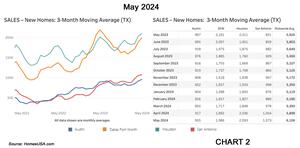
The 3-month average of new home sales in Texas was 3.5% higher than in April as Dallas-Ft. Worth, Houston, Austin, and San Antonio combined posted a 3-month average of 6,106 sales versus 5,899 sales in April. All four major new home sales markets posted higher sales.
Chart 3: Texas New Home Sales Prices Market – May 2024
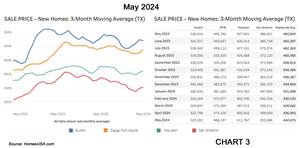
Texas spring home buyers paid more for a new home in May as the average 3-month price was up in Dallas-Ft. Worth, Houston and San Antonio, while slightly lower in Austin. The four largest new home markets combined posted an average sales price in May of $442,676 versus $436,083 in April.
Chart 4: Texas Sales-to-List-Price Ratio Market – May 2024
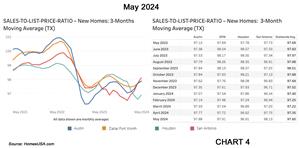
The combined 3-month moving average of the sales-to-list price ratio in Texas’ four largest markets for May was 97.60 versus 97.69 percent a year ago and 97.35 percent in April this year.
Chart 5: Texas Pending New Home Sales Market – May 2024
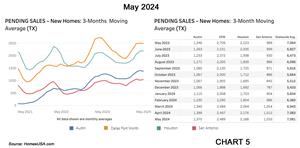
The average 3-month pending new home sales flattened last month in the four largest Texas new home markets. The combined four-market average in May totaled 7,081 versus 7,083 in April.
Chart 6: Texas Active Listings for New Home Market (Inventory) - May 2024
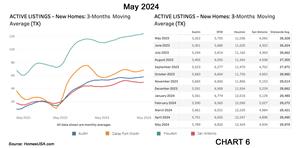
May inventory was nearly unchanged from the previous month, as the 3-month average active listings inventory in Texas’ four major new home markets was 29,979 versus 29,495 in April.
Chart A: Texas 12 - Month Moving Averages Market – May 2024