Increase in Kharmagtai Resource
/EIN News/ -- TORONTO, Aug. 21, 2024 (GLOBE NEWSWIRE) -- Xanadu Mines Ltd (ASX: XAM, TSX: XAM) (Xanadu, XAM or the Company) is pleased to report an increase in the Mineral Resource Estimate (Resource, Mineral Resource Estimate or MRE) for its flagship copper-gold project at Kharmagtai, in the South Gobi region of Mongolia (Figure 1 and Table 1). The updated Resource increases contained copper metal by 14% or 463kt Cu and contained gold by 9% or 764k Oz Au and is largely driven by updating the resource reporting criteria to reflect pit-shells generated in the pre-feasibility study (PFS) in conjunction with re-estimation of the underlying models to include 7,300m of new drilling completed in six holes at White Hill and five diamond drill holes at Golden Eagle.
Highlights
- Significant increase in Kharmagtai Resource from 3.4Mt to 3.8Mt Cu and from 8.5Moz to 9.3Moz Au contained metal, a 463Kt increase in contained copper (Cu) and 764Koz increase in contained gold (Au).
- A small increase of approximately 123kt of contained copper and 156koz of contained gold arose from an update of the underlying models to incorporate new drilling subsequent to the last MRE update (11 holes for approximately 7300m). The Competent Person also made some minor adjustments to classifications as part of this update.
- The balance of the change was driven by reporting the Mineral Resource falling within the revenue factor 1.4 PFS pit optimisation shells to the notional open pit cut-off grade of 0.2% CuEq, with material falling outside those shells reported to the notional mass underground cut-off of 0.3% CuEq resulting a net increase of material being reported at the lower cut-off. The previous approach used subjectively derived flat relative levels to define potentially open pit resources from underground (refer Figure 3).
Xanadu’s Executive Chairman and Managing Director, Mr Colin Moorhead, said “This update reflects and is consistent with the final model informing The Kharmagtai PFS, which is on track for delivery in the current quarter. We are keeping all planned infrastructure outside of the revenue factor 1.4 pit-shells to ensure sufficient flexibility for the open pits to grow in the future. There is therefore a reasonable expectation that mineralisation falling within those pits may eventually be extracted by open pit mining and it is appropriate that this Mineral Resource is reported to cut-off grades that are consistent with this. It is also very pleasing to see underlying resource growth driven by the recent discovery of a zone of higher-grade copper and gold mineralisation at the White Hill, which clearly remains open at depth and supports our exploration model targeting potential underground opportunities beyond the scope of the PFS.”
Table 1: Comparison 2023 vs 2024 Resource
| Resource |
Cutoff (% CuEq) |
Classification |
Tonnes (Mt) |
Grades | Contained Metal | ||||||
| CuEq (%) | Cu (%) | Au (g/t) | CuEq (Mlbs) |
CuEq (kt) |
Cu (kt) |
Au (koz) |
|||||
|
2024 |
0.20 (OC) 0.30 (UG) |
Indicated | 890 | 0.37 | 0.26 | 0.21 | 7,300 | 3,300 | 2,300 | 6,000 | |
| Inferred | 590 | 0.34 | 0.25 | 0.17 | 4,500 | 2,000 | 1,500 | 3,300 | |||
|
20231 |
0.20 (OC) 0.30 (UG) |
Indicated | 790 | 0.38 | 0.27 | 0.22 | 6,700 | 3,000 | 2,100 | 5,600 | |
| Inferred | 460 | 0.37 | 0.27 | 0.19 | 3,800 | 1,700 | 1,300 | 2,900 | |||
Note: Figures may not sum due to rounding and significant figure do not imply an added level of precision.
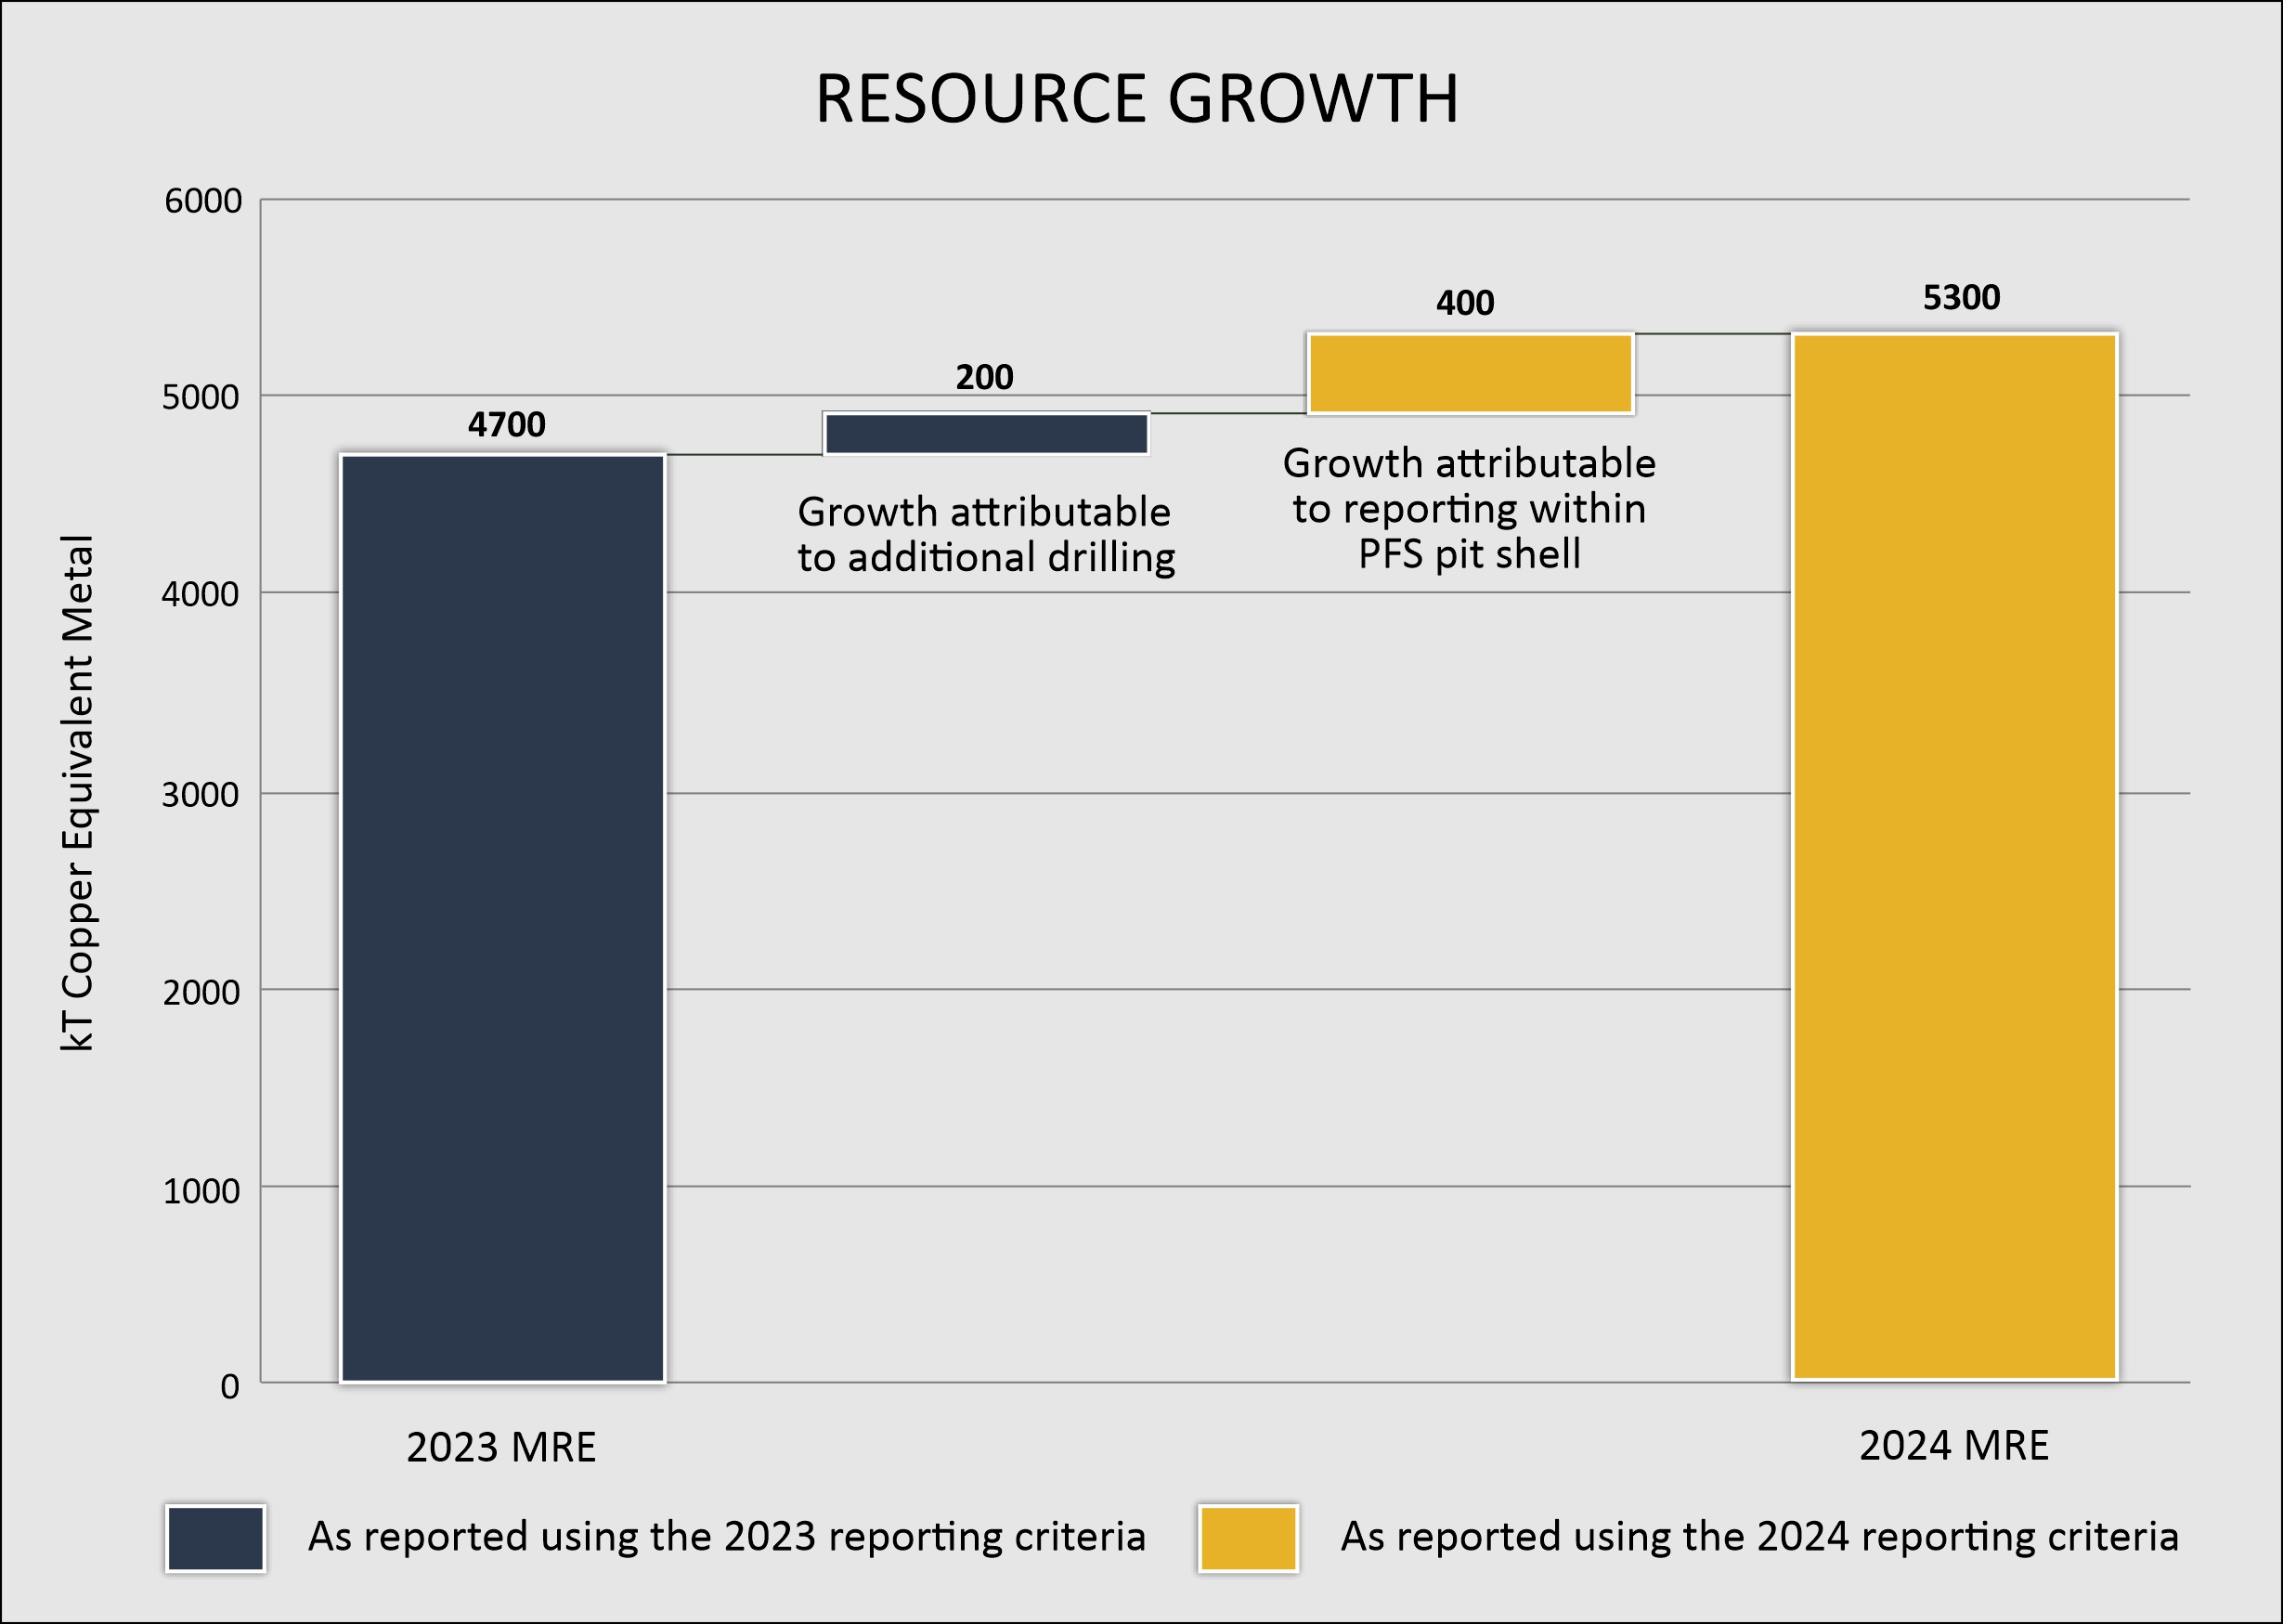
Figure 1. Resource growth in CuEq tonnes between 2023 and 2024 MRE’s. Growth attributable to additional drilling is a comparison of the 2023 and 2024 MRE’s reported using the same 2023 reporting criteria.
MINERAL RESOURCE ESTIMATE UPDATE OVERVIEW
Xanadu engaged independent consultants, Spiers Geological Consultants (SGC), to prepare an updated Resource for Kharmagtai. The Resource has been reported in accordance with the JORC Code 2012, is effective as of 31st July 2024, and is shown in full in Tables 8 to 11.
Drilling results from the past 6 months (including 11 holes for 7,300 metres of drilling) have been incorporated into an updated JORC 2012 Mineral Resource Estimate (MRE) for the Kharmagtai Copper and Gold Deposit in Mongolia (Figure 2).
This Resource is an update to the December 2023 Mineral Resource Estimate. Results from the main body of infill drilling suggested that at White Hill the grades were increasing at depth, below the PEA designated pit and that there was potential that the orebody was shallowing towards the south. White Hill is open at depth (Figure 3), to the south and to the west. Additionally, infill drilling at Golden Eagle has linked two zones of shallow higher-grade gold mineralisation and increased the contained gold within the Golden Eagle resource.
Previous MRE estimations were reported using two different cut-off grades, for open pit (0.2%CuEq) and underground (0.3% CuEq) above and below specifically designated RL’s for each deposit. Levels were based on preliminary optimisation analysis and a 0.2% CuEq cut-off grade during the 2021 Scoping Study. The underground Resource was reported below the nominated mRL’s levels based on preliminary optimisation analysis and a 0.3% CuEq cut-off grade, reported with inside a 0.1%CuEq geological reporting wireframe. Tables 2 and 3 show the 2024 and 2023 Global Resource estimates both using the 2023 criteria described above.
Table 2. 2024 Global Resource combined for OC and UG at 0.2 and 0.3% CuEq respectively in 2023 criteria
| Classification |
Tonnes (Mt) |
Grades | Contained Metal | |||||
| CuEq (%) |
Cu (%) |
Au (g/t) |
CuEq (Mlbs) |
CuEq (kt) |
Cu (kt) |
Au (koz) |
||
| Indicated | 820 | 0.38 | 0.27 | 0.22 | 6,900 | 3,100 | 2,200 | 5,700 |
| Inferred | 480 | 0.37 | 0.27 | 0.19 | 3,900 | 1,800 | 1,300 | 2,900 |
Note: Figures may not sum due to rounding and significant figure do not imply an added level of precision.
Table 3. 2023 Global Resource combined for OC and UG at 0.2 and 0.3% CuEq respectively2
| Classification |
Tonnes (Mt) |
Grades | Contained Metal | |||||
| CuEq (%) |
Cu (%) |
Au (g/t) |
CuEq (Mlbs) |
CuEq (kt) |
Cu (kt) |
Au (koz) |
||
| Indicated | 790 | 0.38 | 0.27 | 0.22 | 6,700 | 3,000 | 2,100 | 5,600 |
| Inferred | 460 | 0.37 | 0.27 | 0.19 | 3,800 | 1,700 | 1,300 | 2,900 |
Note: Figures may not sum due to rounding and significant figure do not imply an added level of precision.
Pit optimisations conducted to inform the ongoing PFS have defined more appropriate spatial constraints for open pit mining with the company using the revenue factor 1.4 pit shells, defined by 1.4x the expected revenue on current PFS assumptions, to inform key infrastructure decisions (i.e. all permanent infrastructure has been designed to fall outside the RF1.4 pit limits). Material falling within those pit-shells is now considered to have reasonable expectation of eventual economic extraction by open pit mining methods, therefore has been reported to a 0.2% CuEq cut-off. Material falling outside those shells continues and below the previously used RL’s are reported at the higher mass underground mining cut-off of 0.3% CuEq. Tables 4 and 5 show the 2024 Global Resource estimate using the previous and current criteria. The net effect of this change was to increase the proportion of the global resource reported at 0.2% v 0.3% (Figure 4).
Table 4. 2024 Global Resource combined for in RV1400fpit and "Other" at 0.2 and 0.3% CuEq respectively
| Classification |
Tonnes (Mt) |
Grades | Contained Metal | |||||
| CuEq (%) | Cu (%) | Au (g/t) | CuEq (Mlbs) | CuEq (kt) | Cu (kt) | Au (koz) | ||
| Indicated | 890 | 0.37 | 0.26 | 0.21 | 7,300 | 3,300 | 2,300 | 6,000 |
| Inferred | 590 | 0.34 | 0.25 | 0.17 | 4,500 | 2,000 | 1,500 | 3,300 |
Note: Figures may not sum due to rounding and significant figure do not imply an added level of precision.
Table 5. 2024 Global Resource combined for OC and UG at 0.2 and 0.3% CuEq respectively in 2023 criteria
| Classification |
Tonnes (Mt) |
Grades | Contained Metal | |||||
| CuEq (%) | Cu (%) | Au (g/t) | CuEq (Mlbs) | CuEq (kt) | Cu (kt) | Au (koz) | ||
| Indicated | 820 | 0.38 | 0.27 | 0.22 | 6,700 | 3,100 | 2,200 | 5,700 |
| Inferred | 480 | 0.37 | 0.27 | 0.19 | 3,900 | 1,800 | 1,300 | 2,900 |
Note: Figures may not sum due to rounding and significant figure do not imply an added level of precision.
SGC considers that data collection techniques are consistent with industry best practice and are suitable for use in the preparation of a Resource to be reported in accordance with JORC Code 2012. Available quality assurance and quality control (QA/QC) data supports the use of the input data provided by Xanadu.
The Resource is considered to have reasonable prospects for eventual economic extraction (RPEEE) on the following basis:
- the deposit is located in a favourable mining jurisdiction, with no known impediments to land access or tenure status; and
- the volume, orientation and grade of the Resource is amenable to mining extraction via traditional open-pit and underground methods;
The Resource models are well understood and there is substantial upside potential to be realised by better understanding the economics of the deposit. As demonstrated in the images below, significant volumes of mineralisation have been modelled that fall outside of the constraining pit wireframe. These parts of the model will be targeted for further investigation through economic studies to assess if more of this material can be brought into the Mineral Resource.
The total Mineral Resource Estimate includes material classified as oxide totalling 50Mt @ 0.34% CuEq which can be found in Table 7.
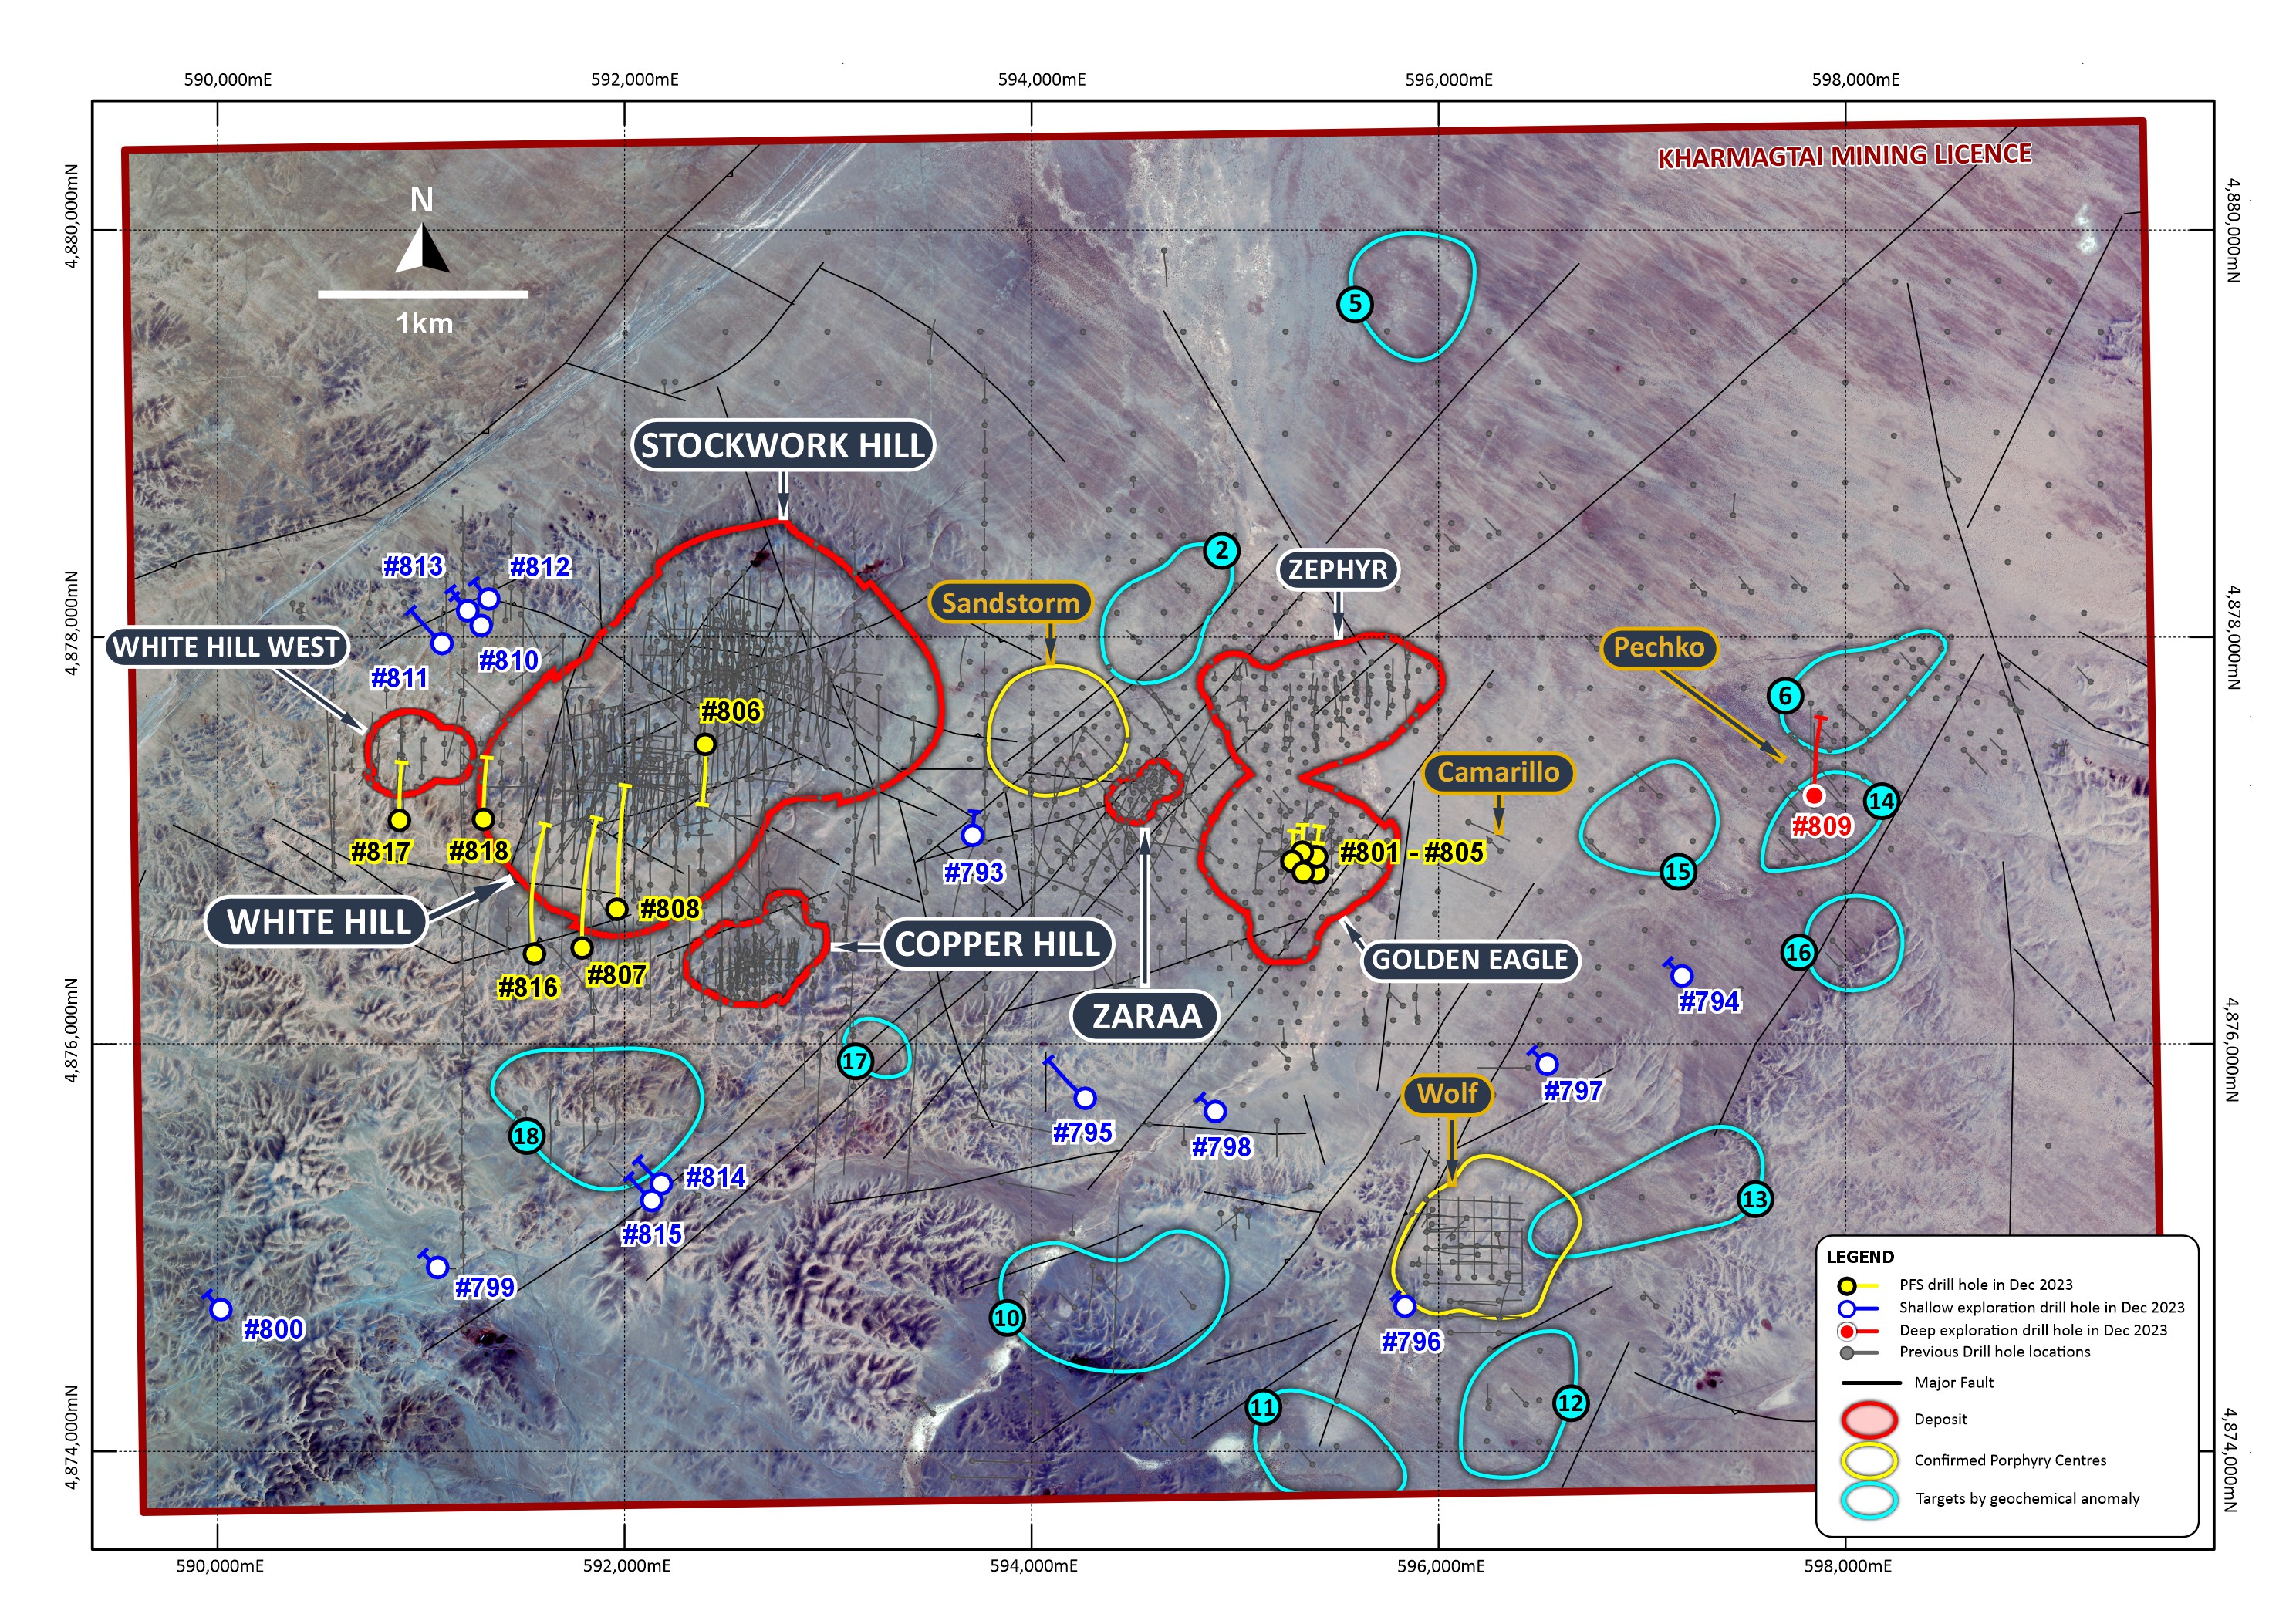
Figure 2: Plan view of the Kharmagtai district showing the additional drilling informing the 2024 MRE update.
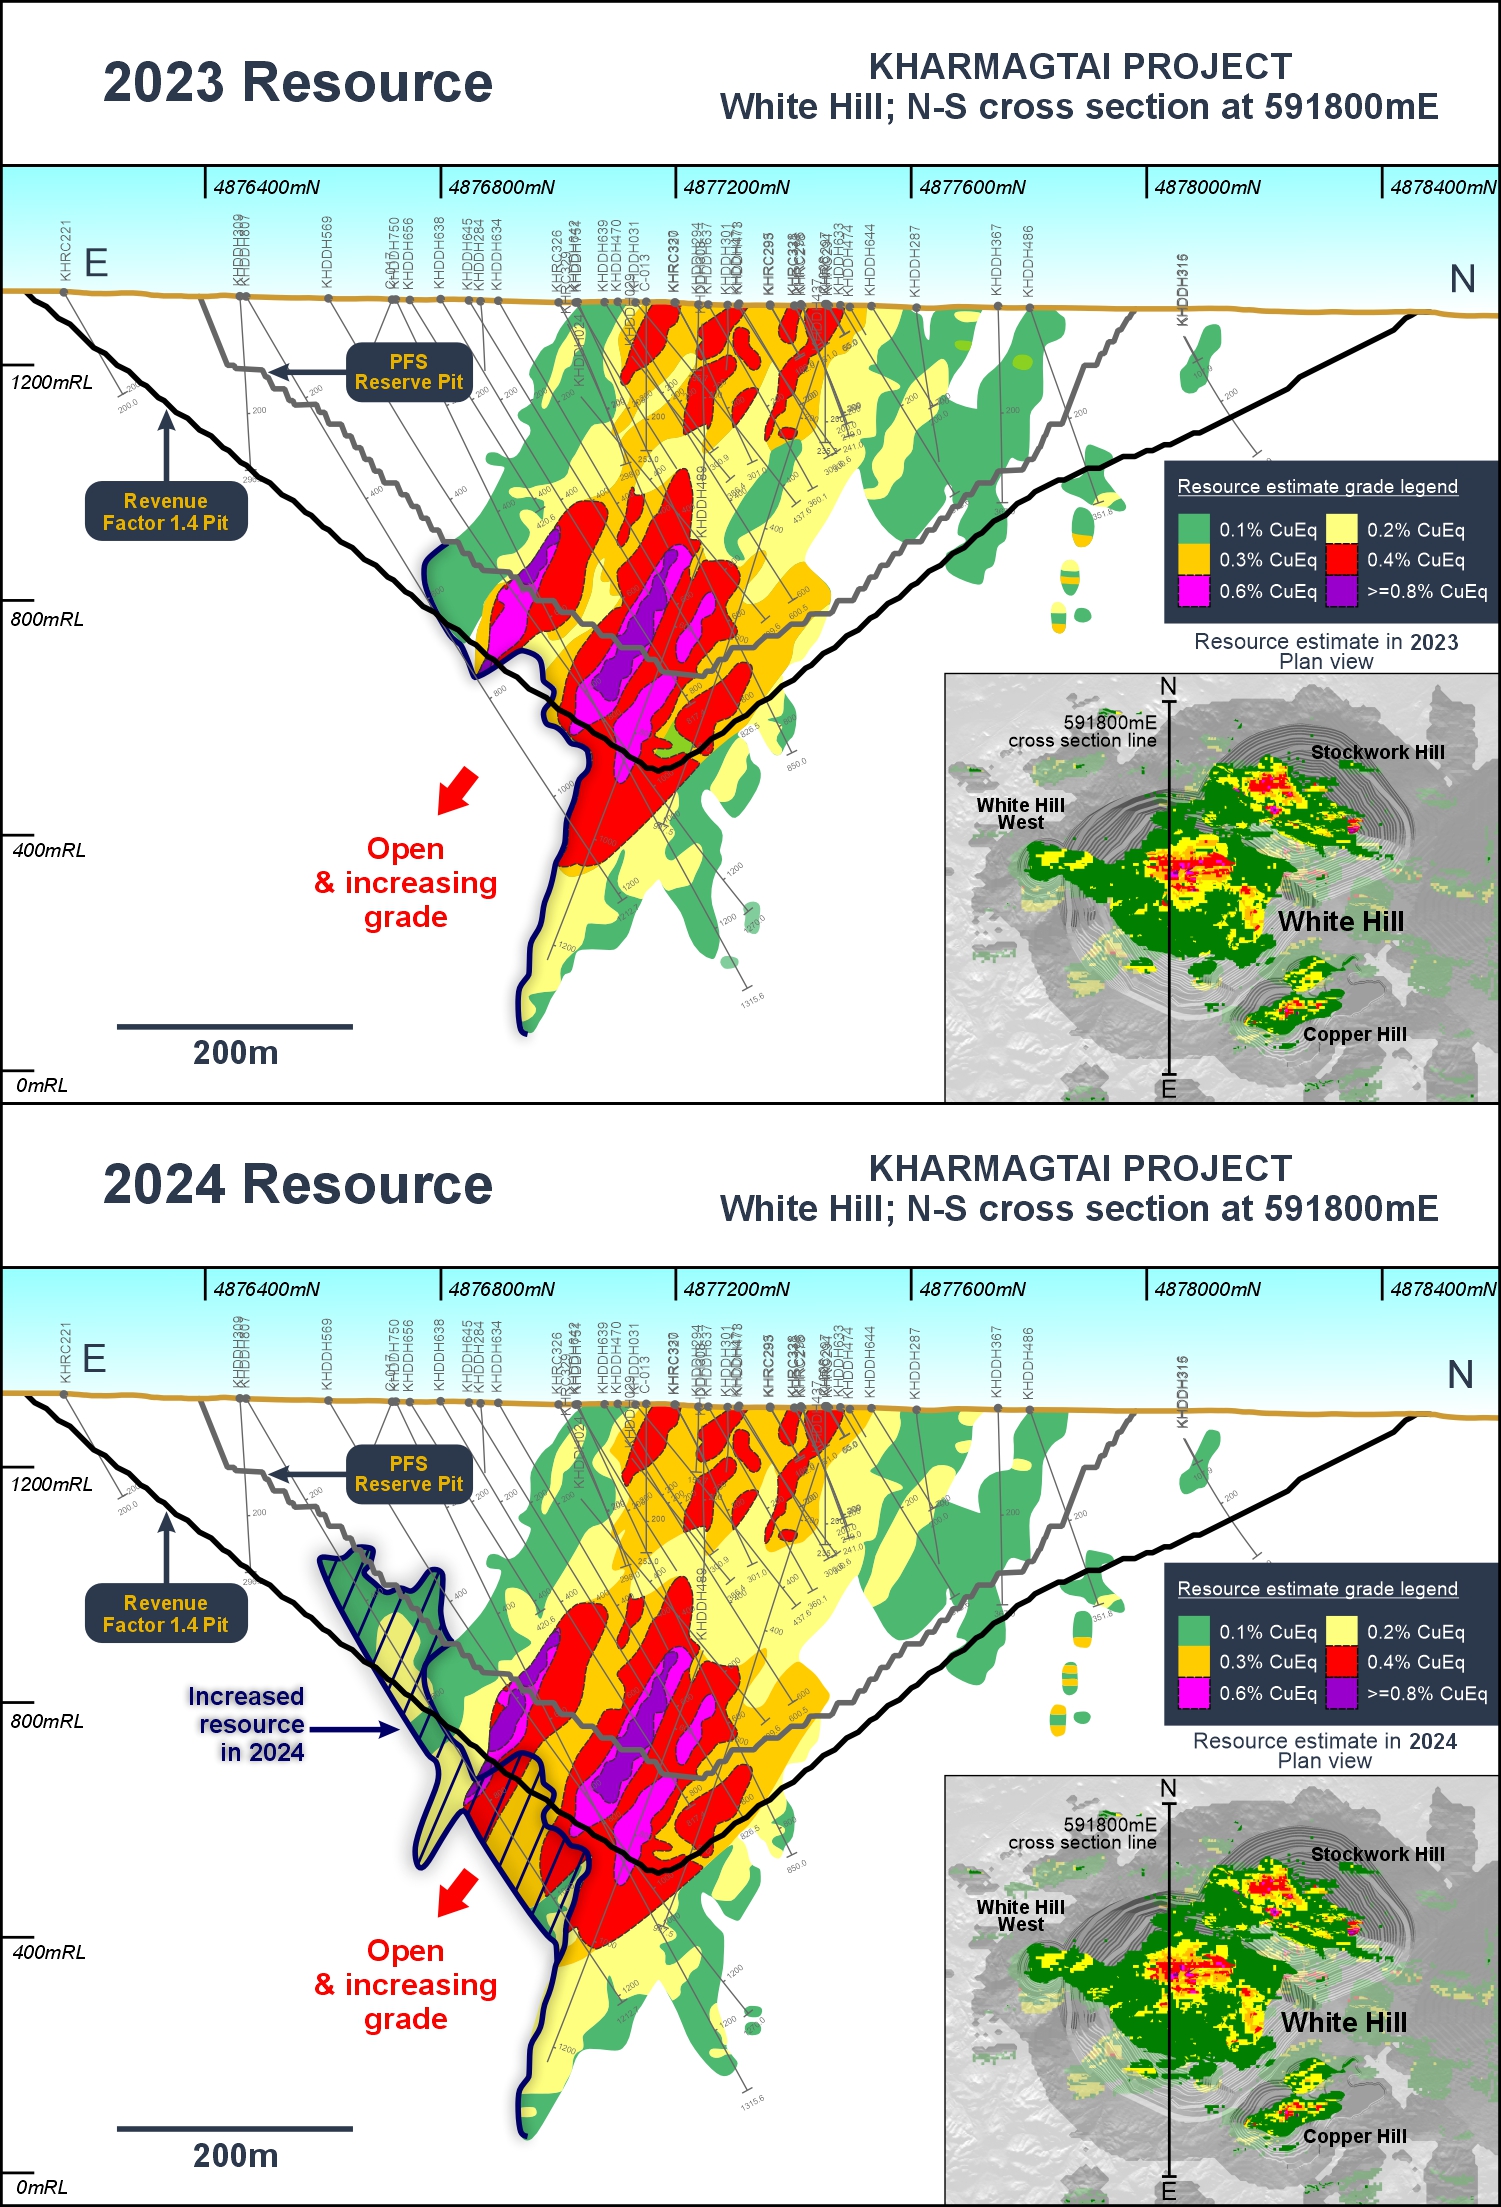
Figure 3: Cross section through the White Hill Deposit showing resource growth and open nature of the White Hill deposit with grades generally increasing with depth. Faulting has shifted the resource towards the surface in the south, suggesting additional drilling may add significant shallower tonnes and change the shape of the current pits.
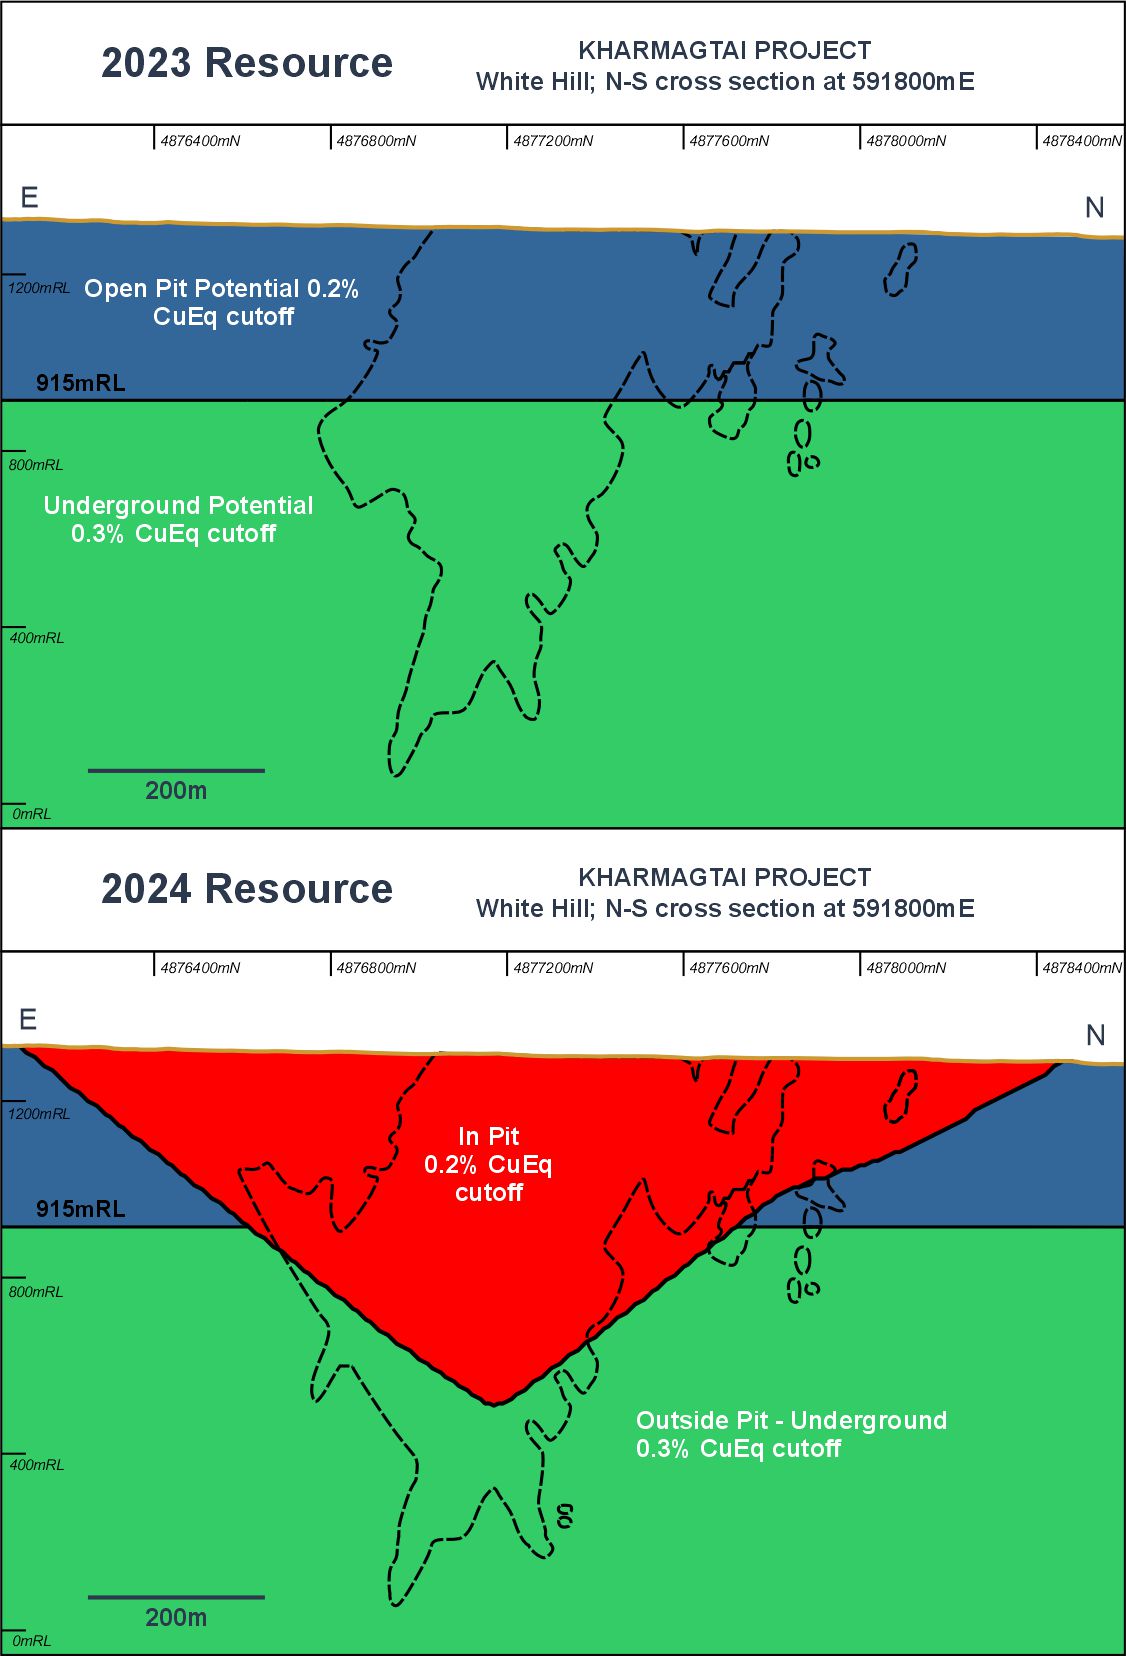
Figure 4: Schematic Cross Sections showing the cut-off grade reporting boundaries at White Hill. The 2023 December estimate was reported using a simplistic RL depth for open pit potential based on work conducted during the 2021 Scoping Study. The 2024 resource is being reported using optimised pit shapes generated during the ongoing PFS.
Tables 6-7 show the 2024 MRE in detail, with resource classification using the 2023 criteria.
Table 6: Kharmagtai Project – Potential Open Pit Mineral Resource Estimates 2024 – by resource classification using the 2023 Reporting Criteria.
| Deposit |
Classification |
Tonnes (Mt) |
Grades | Contained Metal | |||||
| CuEq (%) |
Cu (%) |
Au (g/t) |
CuEq (Mlbs) |
CuEq (kt) |
Cu (kt) |
Au (koz) |
|||
| SH |
Indicated |
190 | 0.42 | 0.28 | 0.28 | 1,800 | 810 | 540 | 1,700 |
| WH | 370 | 0.33 | 0.25 | 0.17 | 2,700 | 1,200 | 910 | 2,000 | |
| CH | 30 | 0.42 | 0.29 | 0.25 | 260 | 120 | 80 | 230 | |
| ZA | 10 | 0.26 | 0.15 | 0.23 | 50 | 20 | 10 | 60 | |
| GE | 40 | 0.28 | 0.12 | 0.29 | 260 | 120 | 50 | 400 | |
| ZE | 20 | 0.31 | 0.18 | 0.26 | 140 | 70 | 40 | 170 | |
| PE | |||||||||
| Total Indicated | 660 | 0.36 | 0.25 | 0.21 | 5,200 | 2,400 | 1,600 | 4,600 | |
| SH |
Inferred |
30 | 0.30 | 0.17 | 0.24 | 200 | 90 | 50 | 230 |
| WH | 80 | 0.26 | 0.20 | 0.12 | 460 | 210 | 160 | 300 | |
| CH | 10 | 0.24 | 0.20 | 0.07 | 40 | 20 | 20 | 20 | |
| ZA | 10 | 0.25 | 0.15 | 0.19 | 60 | 30 | 20 | 70 | |
| GE | 30 | 0.25 | 0.12 | 0.25 | 140 | 60 | 30 | 200 | |
| ZE | 20 | 0.26 | 0.13 | 0.23 | 110 | 50 | 30 | 140 | |
| PE | |||||||||
| Total Inferred | 170 | 0.26 | 0.17 | 0.17 | 1,000 | 460 | 300 | 1,000 | |
Notes:
- CuEq (lbs and t) accounts for Au (g/t) value and CuEq (t) must not be totalled to Au ounces
- Figures may not sum due to rounding
- Significant figures do not imply an added level of precision
- Resource constrained by 0.1%CuEq reporting solid inline with geological analysis by XAM
- Resource constrained by open cut above nominated mRL level by deposit as follows SH>=720mRL, WH>=915mRL, CH>=1100mRL, ZA>=920mRL, ZE>=945mRL, PE>=1100mRL and GE>=845mRL
- CuEq equation (CuEq=Cu+Au*0.60049*0.86667) where Au at USD$1400/oz and Cu at USD$3.4/lb was employed according to the Clients' (XAM) direction.
- Au recovery is relative with Cu rec=90% and Au rec=78% (rel Au rec=78/90=86.667% with number according to the Clients' (XAM) direction
Table 7: Kharmagtai Project – Potential Underground Mineral Resource Estimate 2024 – by resource classification using the 2023 Reporting Criteria.
| Deposit |
Classification |
Tonnes (Mt) |
Grades | Contained Metal | |||||
| CuEq (%) |
Cu (%) |
Au (g/t) |
CuEq (Mlbs) |
CuEq (kt) |
Cu (kt) |
Au (koz) |
|||
| SH |
Indicated |
30 | 0.58 | 0.35 | 0.44 | 400 | 180 | 110 | 440 |
| WH | 100 | 0.46 | 0.37 | 0.16 | 1,000 | 460 | 370 | 530 | |
| CH | - | 0.37 | 0.28 | 0.18 | 30 | 10 | 10 | 20 | |
| ZA | 20 | 0.47 | 0.32 | 0.28 | 250 | 110 | 80 | 220 | |
| GE | - | - | - | - | - | - | - | - | |
| ZE | - | - | - | - | - | - | - | - | |
| PE | |||||||||
| Total Indicated | 160 | 0.48 | 0.36 | 0.24 | 1,700 | 760 | 570 | 1,200 | |
| SH |
Inferred |
30 | 0.42 | 0.32 | 0.20 | 260 | 120 | 90 | 180 |
| WH | 150 | 0.43 | 0.35 | 0.15 | 1,400 | 620 | 510 | 680 | |
| CH | - | 0.36 | 0.30 | 0.12 | 10 | - | - | - | |
| ZA | 130 | 0.43 | 0.30 | 0.25 | 1,200 | 560 | 390 | 1,000 | |
| GE | - | - | - | - | - | - | - | - | |
| ZE | - | 0.40 | 0.06 | 0.67 | - | - | - | - | |
| PE | |||||||||
| Total Inferred | 300 | 0.43 | 0.33 | 0.19 | 2,900 | 1,300 | 990 | 1,900 | |
Notes:
- CuEq (lbs and t) accounts for Au (g/t) value and CuEq (t) must not be totalled to Au ounces
- Figures may not sum due to rounding
- Significant figures do not imply an added level of precision
- Resource constrained by 0.1%CuEq reporting solid inline with geological analysis by XAM
- Resource constrained by open cut above nominated mRL level by deposit as follows SH>=720mRL, WH>=915mRL, CH>=1100mRL, ZA>=920mRL, ZE>=945mRL, PE>=1100mRL and GE>=845mRL
- CuEq equation (CuEq=Cu+Au*0.60049*0.86667) where Au at USD$1400/oz and Cu at USD$3.4/lb was employed according to the Clients' (XAM) direction.
- Au recovery is relative with Cu rec=90% and Au rec=78% (rel Au rec=78/90=86.667% with number according to the Clients' (XAM) direction
Tables 8-11 show the 2024 MRE in detail, with resource classification using the 2024 criteria.
Table 8: Kharmagtai Project – Potential Open Pit Mineral Resource Estimate 2024 within the revenue factor 1.4 pit – by resource classification.
| Deposit |
Classification |
Tonnes (Mt) |
Grades | Contained Metal | |||||
| CuEq (%) |
Cu (%) |
Au (g/t) |
CuEq (Mlbs) |
CuEq (kt) |
Cu (kt) |
Au (koz) |
|||
| SH |
Indicated |
210 | 0.44 | 0.29 | 0.29 | 2,100 | 940 | 610 | 2,000 |
| WH | 500 | 0.35 | 0.26 | 0.16 | 3,800 | 1,700 | 1,300 | 2,600 | |
| CH | 40 | 0.39 | 0.28 | 0.22 | 310 | 140 | 100 | 260 | |
| ZA | 40 | 0.32 | 0.21 | 0.20 | 260 | 120 | 80 | 240 | |
| GE | 40 | 0.28 | 0.12 | 0.29 | 260 | 120 | 50 | 400 | |
| ZE | 20 | 0.31 | 0.18 | 0.26 | 140 | 60 | 40 | 170 | |
| PE | - | - | - | - | - | - | - | - | |
| Total Indicated | 850 | 0.37 | 0.26 | 0.21 | 6,900 | 3,100 | 2,200 | 5,700 | |
| SH |
Inferred |
30 | 0.29 | 0.18 | 0.20 | 190 | 90 | 60 | 200 |
| WH | 210 | 0.34 | 0.27 | 0.12 | 1,500 | 700 | 570 | 820 | |
| CH | 10 | 0.24 | 0.19 | 0.08 | 40 | 20 | 20 | 20 | |
| ZA | 120 | 0.33 | 0.23 | 0.20 | 830 | 380 | 260 | 730 | |
| GE | 20 | 0.25 | 0.12 | 0.25 | 140 | 60 | 30 | 200 | |
| ZE | 10 | 0.24 | 0.15 | 0.17 | 80 | 30 | 20 | 80 | |
| PE | - | - | - | - | - | - | - | - | |
| Total Inferred | 400 | 0.32 | 0.24 | 0.16 | 2,800 | 1,300 | 950 | 2,000 | |
Notes:
- CuEq (lbs and t) accounts for Au (g/t) value and CuEq (t) must not be totalled to Au ounces
- Figures may not sum due to rounding
- Significant figures do not imply an added level of precision
- Resource constrained by 0.1%CuEq reporting solid inline with geological analysis by XAM
- Resource constrained by RV1400fpit (coded field equal to 1)
- CuEq equation (CuEq=Cu+Au*0.60049*0.86667) where Au at USD$1400/oz and Cu at USD$3.4/lb was employed according to the Clients' (XAM) direction.
- Au recovery is relative with Cu rec=90% and Au rec=78% (rel Au rec=78/90=86.667% with number according to the Clients' (XAM) direction
- Resource "other 0p2 and 0p3" NOT inside RV1400fpit above and below nominated mRL level by deposit as follows SH>=720mRL, WH>=915mRL, CH>=1100mRL, ZA>=920mRL, ZE>=945mRL, PE>=1100mRL and GE>=845mRL
- Model: KH_ALL_GLOBAL_OKMOD_FINAL_V3_FORCLIENT_140624_inRV1400fpit
Table 9: Kharmagtai Project – Potential Open Pit Mineral Resource Estimate 2024 outside the revenue factor 1.4 pit at 0.2% CuEq– by resource classification.
| Deposit |
Classification |
Tonnes (Mt) |
Grades | Contained Metal | |||||
| CuEq (%) |
Cu (%) |
Au (g/t) |
CuEq (Mlbs) |
CuEq (kt) |
Cu (kt) |
Au (koz) |
|||
| SH |
Indicated |
- | 0.33 | 0.19 | 0.27 | 10 | - | - | 10 |
| WH | - | 0.29 | 0.20 | 0.17 | 10 | 10 | - | 10 | |
| CH | - | 0.27 | 0.19 | 0.14 | - | - | - | - | |
| ZA | - | - | - | - | - | - | - | - | |
| GE | - | 0.23 | 0.09 | 0.26 | - | - | - | - | |
| ZE | - | 0.29 | 0.10 | 0.37 | - | - | - | - | |
| PE | |||||||||
| Total Indicated | - | 0.30 | 0.19 | 0.22 | 20 | 10 | - | 20 | |
| SH |
Inferred |
10 | 0.39 | 0.18 | 0.41 | 50 | 20 | 10 | 70 |
| WH | 20 | 0.27 | 0.18 | 0.16 | 90 | 40 | 30 | 80 | |
| CH | - | 0.26 | 0.23 | 0.06 | 10 | - | - | - | |
| ZA | - | - | - | - | - | - | - | - | |
| GE | - | 0.25 | 0.12 | 0.24 | 10 | - | - | 10 | |
| ZE | - | 0.33 | 0.08 | 0.47 | 30 | 10 | - | 60 | |
| PE | |||||||||
| Total Inferred | 30 | 0.30 | 0.17 | 0.25 | 180 | 70 | 40 | 220 | |
Notes:
- CuEq (lbs and t) accounts for Au (g/t) value and CuEq (t) must not be totalled to Au ounces
- Figures may not sum due to rounding
- Significant figures do not imply an added level of precision
- Resource constrained by 0.1%CuEqreporting solid inline with geological analysis by XAM
- Resource NOT constrained by RV1400fpit (coded field equal to 1)
- CuEq equation (CuEq=Cu+Au*0.60049*0.86667) where Au at USD$1400/oz and Cu at USD$3.4/lb was employed according to the Clients' (XAM) direction.
- Au recovery is relative with Cu rec=90% and Au rec=78% (rel Au rec=78/90=86.667% with number according to the Clients' (XAM) direction
- Resource "other 0p2 and 0p3" NOT inside RV1400fpit above and below nominated mRL level by deposit as follows SH>=720mRL, WH>=915mRL, CH>=1100mRL, ZA>=920mRL, ZE>=945mRL, PE>=1100mRL and GE>=845mRL
- Model: KH_ALL_GLOBAL_OKMOD_FINAL_V3_FORCLIENT_140624_inRV1400fpit
Table 10: Kharmagtai Project – Potential Underground Mineral Resource Estimate 2024 outside the revenue factor 1.4 pit at 0.3% CuEq– by resource classification.
| Deposit |
Classification |
Tonnes (Mt) |
Grades | Contained Metal | |||||
| CuEq (%) |
Cu (%) |
Au (g/t) |
CuEq (Mlbs) |
CuEq (kt) |
Cu (kt) |
Au (koz) |
|||
| SH |
Indicated |
10 | 0.46 | 0.30 | 0.29 | 140 | 60 | 40 | 130 |
| WH | 10 | 0.41 | 0.35 | 0.12 | 100 | 50 | 40 | 40 | |
| CH | - | 0.33 | 0.23 | 0.19 | - | - | - | - | |
| ZA | 10 | 0.47 | 0.33 | 0.28 | 130 | 60 | 40 | 110 | |
| GE | - | - | - | - | - | - | - | - | |
| ZE | - | - | - | - | - | - | - | - | |
| PE | |||||||||
| Total Indicated | 40 | 0.45 | 0.32 | 0.24 | 380 | 170 | 120 | 280 | |
| SH |
Inferred |
30 | 0.42 | 0.32 | 0.19 | 240 | 110 | 80 | 160 |
| WH | 60 | 0.38 | 0.32 | 0.12 | 480 | 220 | 180 | 210 | |
| CH | - | 0.38 | 0.34 | 0.09 | - | - | - | - | |
| ZA | 80 | 0.42 | 0.30 | 0.23 | 750 | 340 | 240 | 610 | |
| GE | - | - | - | - | - | - | - | - | |
| ZE | - | 0.40 | 0.06 | 0.67 | - | - | - | - | |
| PE | |||||||||
| Total Inferred | 160 | 0.41 | 0.31 | 0.19 | 1,500 | 670 | 500 | 980 | |
Notes:
- CuEq (lbs and t) accounts for Au (g/t) value and CuEq (t) must not be totalled to Au ounces
- Figures may not sum due to rounding
- Significant figuers do not imply an added level of precision
- Resource constrained by 0.1%CuEq reporting solid inline with geological analysis by XAM
- Resource NOT constrained by RV1400fpit (coded field equal to 1)
- CuEq equation (CuEq=Cu+Au*0.60049*0.86667) where Au at USD$1400/oz and Cu at USD$3.4/lb was employed according to the Clients' (XAM) direction.
- Au recovery is relative with Cu rec=90% and Au rec=78% (rel Au rec=78/90=86.667% with number according to the Clients' (XAM) direction
- Resource "other 0p2 and 0p3" NOT inside RV1400fpit above and below nominated mRL level by deposit as follows SH>=720mRL, WH>=915mRL, CH>=1100mRL, ZA>=920mRL, ZE>=945mRL, PE>=1100mRL and GE>=845mRL
- Model: KH_ALL_GLOBAL_OKMOD_FINAL_V3_FORCLIENT_140624_inRV1400fpit
Table 11: Kharmagtai Project – Oxide Mineral Resource Estimate 2024 inside the revenue factor 1.4 pit at 0.2% CuEq– by resource classification.
| Deposit |
Classification |
Tonnes (Mt) |
Grades | Contained Metal | ||||||
| CuEq (%) |
Cu (%) |
Au (g/t) |
CuEq (Mlbs) |
CuEq (kt) |
Cu (kt) |
Au (koz) |
||||
| SH | Indicated |
10 | 0.38 | 0.25 | 0.26 | 74 | 30 | 20 | 70 | |
| WH | 30 | 0.32 | 0.24 | 0.16 | 180 | 80 | 60 | 130 | ||
| CH | 10 | 0.42 | 0.31 | 0.21 | 55 | 20 | 20 | 40 | ||
| ZA | - | 0.33 | 0.12 | 0.40 | 6 | - | - | 10 | ||
| GE | - | 0.33 | 0.11 | 0.42 | 26 | 10 | - | 50 | ||
| ZE | - | 0.32 | 0.20 | 0.24 | 20 | 10 | - | 20 | ||
| PE | - | 0.26 | 0.13 | 0.24 | - | - | - | - | ||
| Total Indicated | 50 | 0.34 | 0.23 | 0.21 | 360 | 170 | 110 | 330 | ||
| SH | Inferred |
- | 0.25 | 0.14 | 0.20 | - | - | - | - | |
| WH | - | 0.29 | 0.22 | 0.14 | 10 | - | - | 10 | ||
| CH | - | 0.24 | 0.20 | 0.07 | - | - | - | - | ||
| ZA | - | 0.29 | 0.13 | 0.30 | - | - | - | - | ||
| GE | - | 0.26 | 0.10 | 0.31 | 10 | - | - | 20 | ||
| ZE | - | 0.21 | 0.05 | 0.31 | - | - | - | - | ||
| PE | - | 0.23 | 0.11 | 0.24 | - | - | - | - | ||
| Total Inferred | - | 0.27 | 0.16 | 0.20 | 30 | 10 | 10 | 30 | ||
Notes:
- CuEq (lbs and t) accounts for Au (g/t) value and CuEq (t) must not be totalled to Au ounces
- Figures may not sum due to rounding
- Significant figures do not imply an added level of precision
- Resource constrained by 0.1%CuEq reporting solid inline with geological analysis by XAM
- Resource constrained by RV1400fpit (coded field equal to 1)
- CuEq equation (CuEq=Cu+Au*0.60049*0.86667) where Au at USD$1400/oz and Cu at USD$3.4/lb was employed according to the Clients' (XAM) direction.
- Au recovery is relative with Cu rec=90% and Au rec=78% (rel Au rec=78/90=86.667% with number according to the Clients' (XAM) direction
- Resource "other 0p2 and 0p3" NOT inside RV1400fpit above and below nominated mRL level by deposit as follows SH>=720mRL, WH>=915mRL, CH>=1100mRL, ZA>=920mRL, ZE>=945mRL, PE>=1100mRL and GE>=845mRL
- Model: KH_ALL_GLOBAL_OKMOD_FINAL_V3_FORCLIENT_140624_inRV1400fpit
ESTIMATE METHODOLOGY
The Kharmagtai resource models have been estimated by Ordinary Kriging (OK) using third party software and are post processed in SGC’s preferred software. An internal process review was conducted by SGC and no third-party modelling was undertaken at this time.
Data searches were aligned consistent with the strike, dip and plunge (where appropriate) of the mineralisation consistent with the domain and geometry modelling as a result of the detailed geological investigation put forth by Xanadu (the Client).
According to the Client’s interpretation, the mineralisation host exhibit geometries which are consistent with those geometries defined by the spatial analysis of grade (in this instance Copper, Gold, Molybdenum and Sulphur).
A nominal composite length of 4 metre down hole was used for inputs which was settled upon during consultation with the Client and the Client’s preferred Geological Consultant team.
Where appropriate data was transformed and geometry modelling and variograms of the variables were calculated and modelled.
Several iterations of the modelling process were undertaken to assess the sensitivity of estimates to estimation parameters. Post processing, model validation and reporting were undertaken in SGC’s preferred third party software in-line with the Client’s end use.
Ordinary kriging of the variables was performed in the UTM_47N grid. Block dimensions were selected in line with data density and modelling methodology as well as taking into account potential mining methodologies. Search and data criteria were assessed and implemented, in-line with modelling strategy. Models were constructed and iteration undertaken to assess modelling sensitivities to data and search criteria.
The block estimates were validated against the informing data to ensure that they were consistent with the original informing data in a three-dimensional sense and within the search neighbourhood via data analysis.
The block estimates were exported to SGC’s preferred third party software and where appropriate, a topographic surface was applied as were other surfaces and solids which may have acted upon the estimates. Each model area was then compiled into a global model where all fields underwent secondary validation and data/s were assigned (where deemed appropriate by SGC in consultation with the Client’s geological team) as well as coding for primary domain and the calculation of Cu% and CuEq% were completed.
Final densities were assigned where necessary and model validation completed ahead of final report preparation.
Individual blocks in the resource models (within the Global Kharmagtai Resource Model) have been allocated a resource classification of Indicated and Inferred confidence category based on the consideration of the number and location of data used to estimate the grade of each block in-line with the modelling approach established during the week-long collaboration between XAM staff, SGC and a third-party representative on behalf of XAM. In addition, further consideration incorporated into the resource classification discussion included (but not limited to) the following aspects, quality control and assurances (both internal to XAM and the associated laboratories employed as well as third party laboratory analysis) relating to sampling, sample handling, sample preparation and analysis, database administration and validation. The resource classification also takes into account structural complexity and the associated geological models and constraining solids, as well as population distributions and geometry.
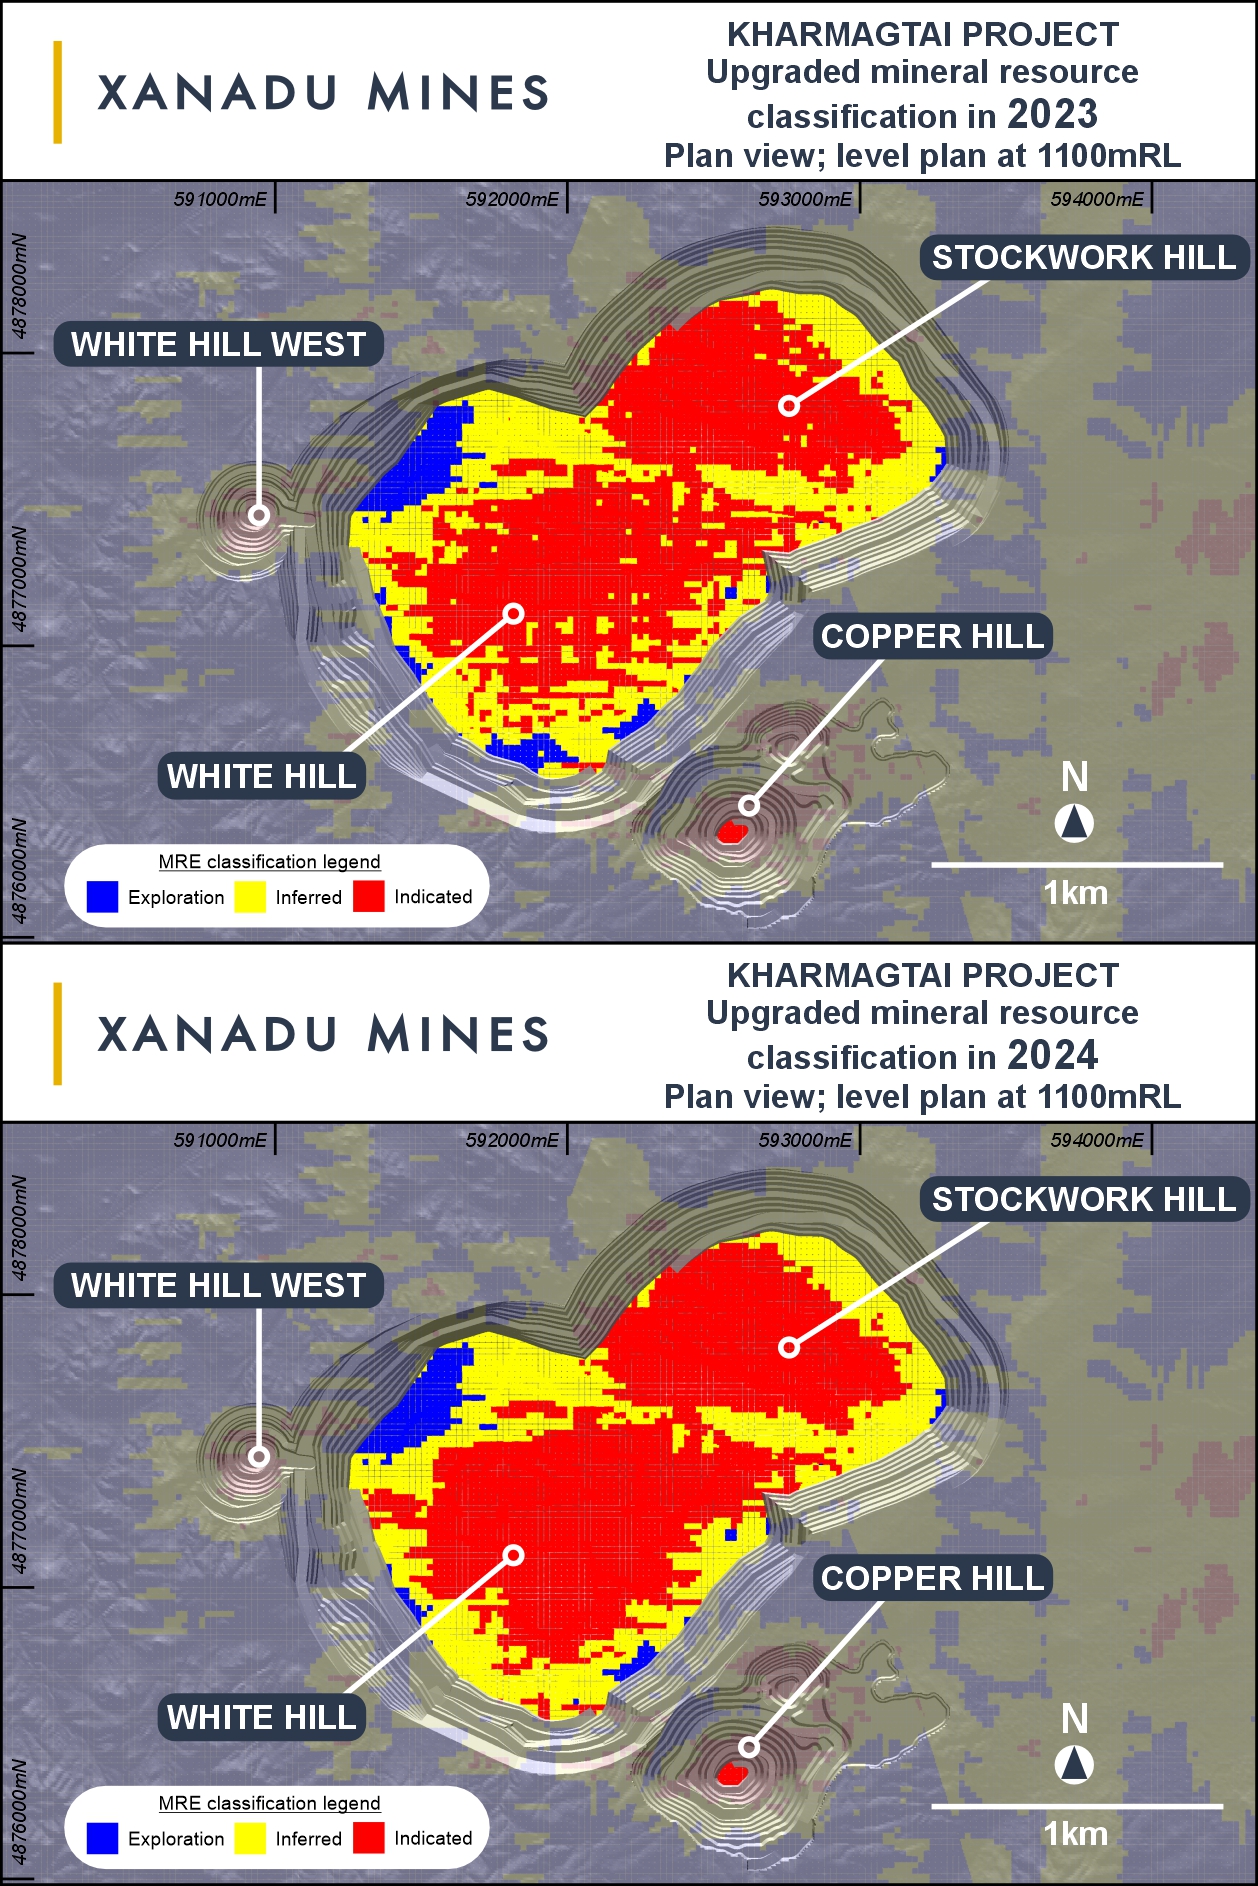
Figure 5: Illustration of resource classification within the 2024 PFS pit shells.
About Xanadu Mines
Xanadu is an ASX and TSX listed Exploration company operating in Mongolia. We give investors exposure to globally significant, large-scale copper-gold discoveries and low-cost inventory growth. Xanadu maintains a portfolio of exploration projects and remains one of the few junior explorers on the ASX or TSX who jointly control a globally significant copper-gold deposit in our flagship Kharmagtai project. Xanadu is the Operator of a 50-50 JV with Zijin Mining Group in Khuiten Metals Pte Ltd, which controls 76.5% of the Kharmagtai project.
For further information, please contact:
Colin Moorhead
Executive Chairman & Managing Director
E: colin.moorhead@xanadumines.com
P: +61 2 8280 7497
This Announcement was authorised for release by Xanadu’s Executive Chair & Managing Director.
Forward-Looking Statements
Certain statements contained in this Announcement, including information as to the future financial or operating performance of Xanadu and its projects may also include statements which are ‘forward‐looking statements’ that may include, amongst other things, statements regarding targets, estimates and assumptions in respect of mineral reserves and mineral resources and anticipated grades and recovery rates, production and prices, recovery costs and results, capital expenditures and are or may be based on assumptions and estimates related to future technical, economic, market, political, social and other conditions. These ‘forward-looking statements’ are necessarily based upon a number of estimates and assumptions that, while considered reasonable by Xanadu, are inherently subject to significant technical, business, economic, competitive, political and social uncertainties and contingencies and involve known and unknown risks and uncertainties that could cause actual events or results to differ materially from estimated or anticipated events or results reflected in such forward‐looking statements.
Xanadu disclaims any intent or obligation to update publicly or release any revisions to any forward‐looking statements, whether as a result of new information, future events, circumstances or results or otherwise after the date of this Announcement or to reflect the occurrence of unanticipated events, other than required by the Corporations Act 2001 (Cth) and the Listing Rules of the Australian Securities Exchange (ASX) and Toronto Stock Exchange (TSX). The words ‘believe’, ‘expect’, ‘anticipate’, ‘indicate’, ‘contemplate’, ‘target’, ‘plan’, ‘intends’, ‘continue’, ‘budget’, ‘estimate’, ‘may’, ‘will’, ‘schedule’ and similar expressions identify forward‐looking statements.
All ‘forward‐looking statements’ made in this Announcement are qualified by the foregoing cautionary statements. Investors are cautioned that ‘forward‐looking statements’ are not guarantee of future performance and accordingly investors are cautioned not to put undue reliance on ‘forward‐looking statements’ due to the inherent uncertainty therein.
For further information please visit the Xanadu Mines’ Website at www.xanadumines.com.
APPENDIX 1: COMPETENT PERSON’S STATEMENT
Mr Robert Spiers is a full time Principal Geologist employed by Spiers Geological Consultants (SGC), 4 Martin Street, Mount Martha, Victoria, Australia. Mr Spiers is contracted on a consulting basis by Xanadu Mines.
Mr Spiers graduated with a Bachelor of Science (BSc) Honours and a double Major of Geology and Geophysics from Latrobe University, Melbourne, Victoria, Australia and has been a member of the Australian Institute of Geoscientists for 26 years; working as a Geologist for in-excess of 30 years since graduating.
Mr Spiers has sufficient experience that is relevant to the style of mineralisation and type of deposit under consideration and to the activity being undertaking to qualify as a Competent Person as defined in the 2012 Edition of the ‘Australasian Code for Reporting of Exploration Results, Mineral Resources and Ore Reserves’. Mr Spiers consents to the inclusion in the report to which this statement is to be attached of the matters based on his information in the form and context in which it appears.
The information in the report to which this statement is to be attached that relates to Mineral Resources is based on information compiled by Mr Robert Spiers, a Competent Person who is a Member of the Australian Institute of Geoscientists or a ‘Recognised Professional Organisation’ (RPO) included in a list posted on the ASX website from time to time.
Mr Spiers consents to the disclosure of this information on the page/s in the form and context in which it appears.
To the best Mr Spiers knowledge, neither SGC, himself and / or other related parties have any conflict of interest with by XAM in accordance with the transparency principle set out by the JORC code and supported by ASX rulings.
In relation to the above statement, Mr Spiers holds 750,000 ordinary shares in the ASX listed XAM entity purchased on market in accordance with the XAM trading policy (guidance notes 27). The aforementioned shareholding does not constitute a material holding in the company in question.
Mr Spiers has read the definition of “competent person” set out in the JORC code and guidelines for the reporting of Mineral Resource Estimates and certify that by reason of his education, affiliation with a professional association (MAIG) and past relevant work experience, that he fulfils the requirements of a “Competent Person” for the purposes of JORC 2012.
As of the date of this document, to the best of Mr Spiers knowledge, information and belief, the Public Release / Technical Report to which this statement is to be attached (in relation to the Reporting of the Kharmagtai Mineral Resource Estimation December 2023) contains all the scientific and technical information that is required to be disclosed in relation to the Mineral Resources to make the Public Release / Technical Report not misleading with respect to the sections for which Mr Spiers is responsible.
Dated the 21st day of August 2024.

__________________________
Robert Spiers, BSc Hons, MAIG
Our Customer
This report has been produced by or on behalf of Spiers Geological Consultants (SGC) for the sole use by Xanadu Mines (XAM or the Customer). The Customer’s use and disclosure of this report is subject to the terms and conditions under which SGC prepared the report. All items in the report must if used in a third-party report be taken in context and consent from SGC must be sought on each occasion.
Notice to Third Parties
SGC prepared this report for the Customer only. If you are not the Customer:
- SGC have prepared this report having regard to the particular needs and interests of the Customer, and in accordance with the Customer’s instructions. It did not draft this report having regard to any other person’s particular needs or interests. Your needs and interests may be distinctly different to the Customer’s needs and interests, and the report may not be sufficient, fit or appropriate for your purposes.
- SGC does not make and expressly disclaims from making any representation or warranty to you – express or implied regarding this report or the conclusions or opinions set out in this report (including without limitation any representation or warranty regarding the standard of care used in preparing this report, or that any forward-looking statements, forecasts, opinions or projections contained in the report will be achieved, will prove to be correct or are based on reasonable assumptions).
- SGC expressly disclaim any liability to you and any duty of care to you.
- SGC does not authorise you to rely on this report. If you choose to use or rely on all or part of this report, then any loss or damage you may suffer in so doing is at your sole and exclusive risk.
Inputs, Subsequent Changes and No Duty to Update
SGC have created this report using data and information provided by or on behalf of the Customer [and Customer’s agents and contractors]. Unless specifically stated otherwise, SGC has not independently verified that data and information unless expressly noted. SGC accepts no liability for the accuracy or completeness of that data and information, even if that data and information has been incorporated into or relied upon in creating this report (or parts of it).
The conclusions and opinions contained in this report apply as at the date of the report. Events (including changes to any of the data and information that SGC used in preparing the report) may have occurred since that date which may impact on those conclusions and opinions and make them unreliable. SGC is under no duty to update the report upon the occurrence of any such event, though it reserves the right to do so.
Mining Unknown Factors
The ability of any person to achieve forward-looking production and economic targets is dependent on numerous factors that are beyond SGC’s control and that SGC cannot anticipate. These factors include, but are not limited to, site-specific mining and geological conditions, management and personnel capabilities, availability of funding to properly operate and capitalize the operation, variations in cost elements and market conditions, developing and operating the mine in an efficient manner, unforeseen changes in legislation and new industry developments. Any of these factors may substantially alter the performance of any mining operation.
APPENDIX 2: ADDITIONAL STATEMENTS AND DISCLAIMERS
Mineral Resources and Ore Reserves Reporting Requirements
The 2012 Edition of the Australasian Code for Reporting of Exploration Results, Mineral Resources and Ore Reserves (the JORC Code 2012) sets out minimum standards, recommendations and guidelines for Public Reporting in Australasia of Exploration Results, Mineral Resources and Ore Reserves. The Information contained in this Announcement has been presented in accordance with the JORC Code 2012.
The information in this Announcement relates to the exploration results previously reported in ASX Announcements which are available on the Xanadu website at:
https://www.xanadumines.com/site/investor-centre/asx-announcements
The Company is not aware of any new, material information or data that is not included in those market announcements.
Copper Equivalent Calculations
The copper equivalent (CuEq or eCu) calculation represents the total metal value for each metal, multiplied by the conversion factor, summed and expressed in equivalent copper percentage with a metallurgical recovery factor applied.
Copper equivalent grade values were calculated using the following formula:
CuEq or eCu = Cu + Au * 0.60049 * 0.86667,
Gold Equivalent (eAu) grade values were calculated using the following formula:
eAu = Au + Cu / 0.60049 * 0.86667.
Where:
Cu - copper grade (%)
Au - gold grade (g/t)
0.60049 - conversion factor (gold to copper)
0.86667 - relative recovery of gold to copper (86.67%)
The copper equivalent formula was based on the following parameters (prices are in USD):
- Copper price - 3.4 $/lb
- Gold price - 1400 $/oz
- Copper recovery - 90%
- Gold recovery - 78%
Relative recovery of gold to copper = 78% / 90% = 86.67%.
APPENDIX 3: KHARMAGTAI TABLE 1 (JORC 2012)
Set out below is Section 1 and Section 2 of Table 1 under the JORC Code, 2012 Edition for the Kharmagtai project. Data provided by Xanadu. This Table 1 updates the JORC Table 1 disclosure dated 8 December 2023.
JORC TABLE 1 - SECTION 1 - SAMPLING TECHNIQUES AND DATA
(Criteria in this section apply to all succeeding sections).
| Criteria | Commentary |
| Sampling techniques |
|
| Drilling techniques |
|
| Drill sample recovery |
|
| Logging |
|
| Sub-sampling techniques and sample preparation |
|
| Quality of assay data and laboratory tests |
|
| Verification of sampling and assaying |
|
| Location of data points |
|
| Data spacing and distribution |
|
| Orientation of data in relation to geological structure |
|
| Sample security |
|
| Audits or reviews |
|
JORC TABLE 1 - SECTION 2 - REPORTING OF EXPLORATION RESULTS
(Criteria in this section apply to all succeeding sections).
| Criteria | Commentary |
|
Mineral tenement and land tenure status |
|
|
Exploration done by other parties |
|
|
Geology |
|
|
Drill hole Information |
|
|
Data Aggregation methods |
Copper equivalent (CuEq or eCu) grade values were calculated using the following formula: eCu or CuEq = Cu + Au * 0.60049 * 0.86667, Gold Equivalent (eAu) grade values were calculated using the following formula: eAu = Au + Cu / 0.60049 * 0.86667. Where: Cu - copper grade (%) Au - gold grade (g/t) 0.60049 - conversion factor (gold to copper) 0.86667 - relative recovery of gold to copper (86.67%) The copper equivalent formula was based on the following parameters (prices are in USD):
|
|
Relationship between mineralisation on widths and intercept lengths |
|
| Diagrams |
|
|
Balanced reporting |
|
|
Other substantive exploration data |
|
|
Further Work |
|
JORC TABLE 1 - SECTION 3 - ESTIMATION AND REPORTING OF MINERAL RESOURCES
| Criteria | Commentary |
| Database integrity | The database is managed using Micromine Geobank software. Data is logged directly into an Excel spread sheet logging system with drop down field lists. Validation checks are written into the importing program ensures all data is of high quality. Digital assay data is obtained from the Laboratory, QA/QC checked and imported. Geobank exported to CSV TEXT and imported directly to the Micromine software used for the MRE.
|
| Site visits |
|
| Geological interpretation | Geological data has been collected in a consistent manner that has allowed the development of geological models to support the Mineral Resource estimate. Copper and gold mineralisation is controlled by porphyry phases, oxidation zone, the level of veining, breccia, country rocks and barren dykes.
|
| Dimensions |
|
| Estimation and modelling techniques |
|
| Moisture |
|
| Cut-off parameters |
|
| Mining factors or assumptions |
|
| Metallurgical factors or assumptions |
|
| Environmental factors or assumptions |
|
| Bulk density |
|
| Classification |
|
| Audits or reviews |
|
| Discussion of relative accuracy/confidence |
|
JORC TABLE 1 - SECTION 4 - ESTIMATION AND REPORTING OF ORE RESERVES
Ore Reserves are not reported so Section 4 is not applicable to this Announcement.
Photos accompanying this announcement are available at
https://www.globenewswire.com/NewsRoom/AttachmentNg/74a9929d-aa56-41a7-9485-78ce2c9d267b
https://www.globenewswire.com/NewsRoom/AttachmentNg/2eea4a23-bf41-4a3f-b1cb-09733767a0cb
https://www.globenewswire.com/NewsRoom/AttachmentNg/195841f8-35a7-4658-81a7-0398ff0646b5
https://www.globenewswire.com/NewsRoom/AttachmentNg/354406c4-d9d3-499f-848b-2a74b682043c
https://www.globenewswire.com/NewsRoom/AttachmentNg/a4d88903-f184-4a84-9a29-3097187927ad
https://www.globenewswire.com/NewsRoom/AttachmentNg/fafcc17d-63cf-434e-a2c2-60da00e5142c
1 ASX/TSX Announcement 8 December 2023 – Kharmagtai Mineral Resource grows by 13% CuEq; including >25% increase in higher-grade core
2 ASX/TSX Announcement 8 December 2023 – Kharmagtai Mineral Resource grows by 13% CuEq; including >25% increase in higher-grade core

![]()
Figure 1

Resource growth in CuEq tonnes between 2023 and 2024 MRE’s. Growth attributable to additional drilling is a comparison of the 2023 and 2024 MRE’s reported using the same 2023 reporting criteria.
Figure 2
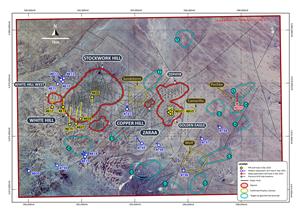
Plan view of the Kharmagtai district showing the additional drilling informing the 2024 MRE update.
Figure 3
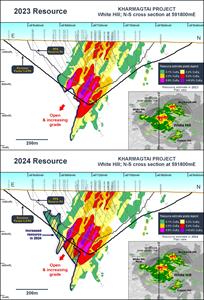
Cross section through the White Hill Deposit showing resource growth and open nature of the White Hill deposit with grades generally increasing with depth. Faulting has shifted the resource towards the surface in the south, suggesting additional drilling may add significant shallower tonnes and change the shape of the current pits.
Figure 4
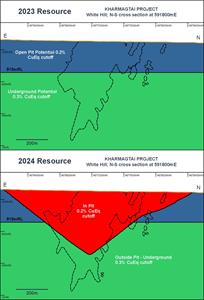
Schematic Cross Sections showing the cut-off grade reporting boundaries at White Hill. The 2023 December estimate was reported using a simplistic RL depth for open pit potential based on work conducted during the 2021 Scoping Study. The 2024 resource is being reported using optimised pit shapes generated during the ongoing PFS.
Figure 5
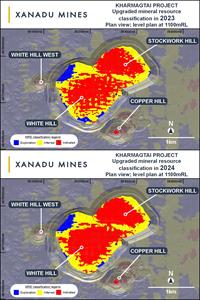
Illustration of resource classification within the 2024 PFS pit shells.
Robert Spiers, Bsc Hons, MAIG

Dated the 21st day of August 2024
Legal Disclaimer:
EIN Presswire provides this news content "as is" without warranty of any kind. We do not accept any responsibility or liability for the accuracy, content, images, videos, licenses, completeness, legality, or reliability of the information contained in this article. If you have any complaints or copyright issues related to this article, kindly contact the author above.