The empirical performance of ECB/Eurosystem staff inflation projections since 2000
Prepared by Mohammed Chahad, Anna-Camilla Hofmann-Drahonsky, Willi Krause, Bettina Landau and Antoine Sigwalt
1 Introduction
Macroeconomic forecasting plays a key role in shaping the monetary policy of central banks. Inflation forecasts enable the ECB to anticipate risks of notable deviations from its medium-term inflation target of 2% and to adjust proactively its monetary policy instruments to counter them. Medium-term forecasts are particularly important for the timely adjustment of monetary policy, given the time-varying lags in the transmission of monetary policy shocks to the economy.[1]
ECB/Eurosystem staff forecasts are conditional on a set of assumptions, with errors in these assumptions constituting potential key factors behind forecast errors. Both short-term and medium-term inflation forecasts are conditioned on a set of assumptions, and such conditional forecasts are referred to as projections. These assumptions cover variables related to the international environment, commodity prices, exchange rates and interest rates. This implies that for each exercise significant discrepancies between these conditioning assumptions and their final outcomes can lead to large projection errors in variables of interest, such as inflation and growth. Errors in conditioning assumptions often turn out to be a key factor in projection errors. Other factors stem from unexpected economic shocks, or at least their unexpected magnitude; model misspecifications, as some models might fail to correctly simulate the transmission of these shocks to the rest of the economy, even if they are perfectly forecast; and, finally, deficiencies in the expert judgement used to address some of these forecasting limitations.
The recent surge in inflation has been accompanied by significant projection errors by ECB/Eurosystem staff, which highlights the need to constantly monitor and analyse forecast errors in order to understand their implications for the projection process. Two Economic Bulletin boxes in 2022 and 2023 analysed the large inflation projection errors occurring at that time, while a third box in early 2024 documented an improvement in the projections concurrent with the more recent decrease in inflation.[2] While these boxes focused on forecast accuracy, other studies also looked at different properties of ECB/Eurosystem projections, such as their unbiasedness and efficiency.[3] Forecasts are considered efficient if the forecast errors cannot be explained by any other information available to the forecasters at the time of projection. A forecast which is both unbiased and efficient is called rational.[4] Kontogeorgos and Lambrias concluded that the ECB/Eurosystem inflation projections are rational.[5] However, the sample period considered preceded the coronavirus (COVID-19) pandemic and the subsequent atypical shocks that hit global and, especially, euro area economies. Moreover, the study relied mainly on standard tests, which do not account for time-varying forecast performance.
This article complements previous analyses of ECB/Eurosystem inflation forecast errors in three ways. First, it extends the time frame by including data from early 2000 to the beginning of 2024, offering a more comprehensive picture of ECB/Eurosystem staff projection performance. Second, the article further deepens the analysis by evaluating the properties of the inflation projections using tests that are robust to unstable environments where model performance may shift over time (see Box 1). Third, it also looks for factors that can potentially explain headline HICP projection properties by: (i) analysing HICP components such as food, energy, and HICP excluding energy and food (HICPX); and (ii) examining the role of certain conditioning assumptions. While the latter is directly linked to the conditioning nature of the projections, the analysis of HICP components relates to the bottom-up approach to projecting headline HICP inflation, since ECB/Eurosystem HICP inflation projections are derived from the aggregation of projections of a set of HICP components.
Overall, this article offers a comprehensive empirical evaluation of ECB/Eurosystem staff projections of euro area inflation since early 2000. Section 2 presents the data used to conduct the analysis and evaluates the performance of the ECB/Eurosystem staff projections relative to the predictions of other forecasters and the role played by errors in the conditioning assumptions. Section 3 evaluates the forecasting performance of the ECB/Eurosystem staff projections in absolute terms by discussing projection properties for both headline inflation and its components and looks into the drivers of the errors.
Box 1
Assessing time-varying forecast performance: the fluctuation test and the fluctuation rationality test
In the presence of time-varying forecast performance (“instabilities”), two tests can be used: (i) the fluctuation rationality test (Rossi and Sekhposyan) to evaluate absolute forecast performance and test in particular for forecast rationality (unbiasedness and efficiency); and (ii) the fluctuation test (Giacomini and Rossi) to compare the forecast performance of two competing projections (relative forecast performance).[6]
Fluctuation rationality test
The Rossi and Sekhposyan (R&S) fluctuation rationality test is a regression-based test (see Mincer and Zarnowitz; and West and McCracken).[7] It is meant to test different hypotheses about the forecasts in the presence of instabilities. In practice, the forecast error associated with an h-step-ahead forecast () is regressed on a vector function :
Where is the associated realisation. All tests consist in testing the null hypothesis : vs : through the standard Wald statistic with different values for For unbiasedness, i.e. to check whether the forecast errors are on average equal to the actual observed values, we set . Testing for the efficiency of the forecast implies checking that no relevant information available to the forecasters at the date of the forecast can explain the forecast errors. A particular example of efficiency is to test whether forecasts adapt too smoothly to macroeconomic shocks and underreact to new information. This is the case if forecast revisions partly explain the projection errors. In this so-called oversmoothing test,
One of the main value-addeds of the R&S test is the ability to derive critical values for statistics computed over rolling windows in order to check for time-varying forecast rationality. The critical values depend on the size of the rolling window and the size of the sample. This method avoids the pitfalls of averaging out instabilities, thereby providing a more accurate assessment of forecast rationality in the presence of instabilities. The null hypothesis is rejected if the test statistic exceeds the critical value at least once over the set of rolling windows. This test can provide better evidence against forecast rationality than traditional tests.
Fluctuation test
The Giacomini and Rossi (G&R) fluctuation test examines the local relative performance of two competing forecasts over time using rolling windows. This follows the standard Diebold and Mariano and Giacomini and White tests and conducts the tests over rolling windows to account for time-varying relative performance.[8] In practice, we consider a quadratic loss function and compute the out-of-sample mean squared forecast error (MSFE) differences between the two projections across each window where is the MSFE associated with the ECB/Eurosystem projection () and the benchmark (). The test checks whether this difference is significantly different from zero using a simple regression-based approach with rolling window estimates as in the fluctuation rationality test. If this difference exceeds the critical values at any point, it suggests that one forecast has outperformed the other during that specific window.
These rolling window approaches allow the tests to adapt to potential changes in the data-generating process, making them particularly useful in unstable environments where forecast performance may vary over time.
2 ECB/Eurosystem staff inflation projection accuracy
Overview of the data
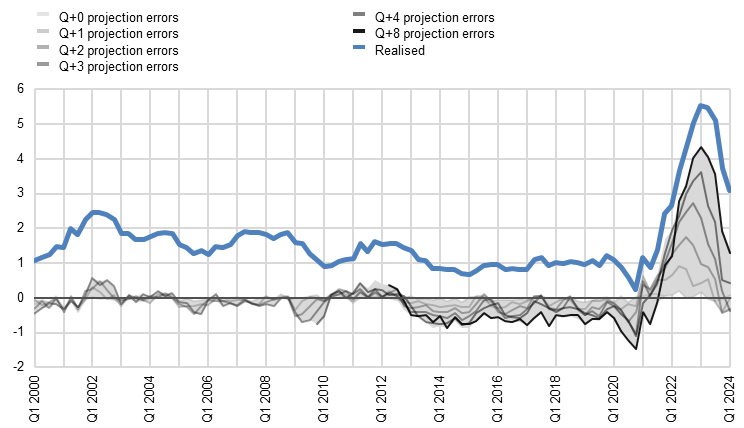
To assess the accuracy and some properties of ECB/Eurosystem staff projections, we use a quarterly database of projection errors constructed for headline HICP inflation and the main HICP components. Forecast errors are defined as realisations minus projections at Q+0 to Q+8 horizons. Realisations are taken from the second release of real-time datasets and Q+0 refers to the nowcasting of inflation in the same quarter, while Q+8 refers to an eight-quarters-ahead forecast (see, for instance, Chart 1, which depicts the dynamics of HICP inflation errors at different forecast horizons). We consider the largest samples available for all these data, also covering periods affected by hard-to-predict events that led to large forecast errors, such as the global financial crisis or Russia’s war against Ukraine. In addition, we construct a database of headline inflation projection errors, adjusted for the impact of energy prices, exchange rates, interest rates and stock prices (“market-based assumptions”), as well as the export prices of trade partners, foreign demand and food prices (“non-market-based assumptions”). This adjustment was conducted by removing errors due to these conditioning assumptions using linear elasticities from the Eurosystem forecasting models estimated in real time. This boils down to computing the path for the ECB/Eurosystem staff projections which would have been produced if the forecasters had known in advance the actual path of those assumptions, which are, in several cases, such as energy commodity prices, not forecast by ECB/Eurosystem staff. This helps the assessment of whether the source of the errors is due to the conditioning assumptions or other reasons, such as model misspecification.
Chart 1
Headline HICP inflation and ECB/Eurosystem projection errors for headline HICP inflation at horizons Q+0 to Q+8
(annual percentage changes; percentage point errors, quarterly data)
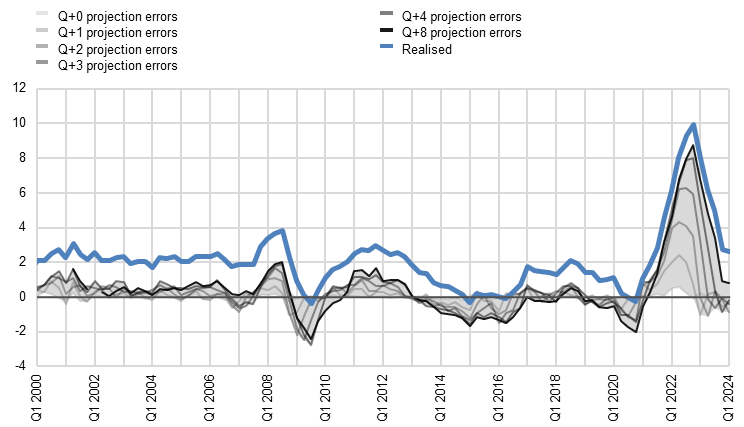
Sources: ECB/Eurosystem staff projections and ECB calculations.
Notes: The blue line indicates the realisations of year-on-year (y-o-y) HICP inflation in percentages. The various grey lines illustrate ECB/Eurosystem staff HICP projection errors in percentage points, defined as realised y-o-y HICP inflation minus the corresponding projection at various horizons from Q+0 (lightest grey) to Q+8 (darkest grey). The grey shaded area encompasses the entire range of these projection errors across the different time horizons.
To compare the ECB/Eurosystem staff projections to other forecasts, a similar database was constructed including both survey and market-based inflation forecasts. Given their good empirical performance (see, for instance, Faust and Wright), survey-based forecasts provide useful benchmarks.[9] This article relies in particular on Consensus Economics forecasts, as these share properties required for comparison with ECB/Eurosystem staff projections, such as a large sample coverage and fixed-horizon projections. For similar reasons, we also consider market-based forecasts, which in our analysis relate to two main instruments: inflation-linked swaps (ILSs) and inflation fixings (see Table 1, which summarises all data available and some of their characteristics). ILSs are available starting from a one-year maturity and in subsequent one-year spot horizon intervals. Shorter maturities are derived by linearly interpolating the seasonally adjusted log-price index on a quarterly basis from the ILS rates and reintroducing seasonality on the basis of the historical patterns observed over the past five years on a rolling basis. Inflation fixings, starting in September 2018, provide information at shorter maturities than ILS rates. Both instruments primarily track the HICP excluding tobacco. Moreover, inflation rates derived from these instruments reflect not just inflation expectations but also inflation risk premia, which may be positive or negative. Although non-inflation risk premia and other imperfections (often collectively termed “liquidity premia”) could influence these products, their impact on the informational content and forecasting capability is considered minor.[10]
Table 1
Availability of benchmark projections
First observation |
Latest observation |
Comments |
|
|---|---|---|---|
ECB/Eurosystem staff projections |
|||
HICP |
Q4 1998 |
Q1 2024 |
|
HICP energy |
Q4 1998 |
Q1 2024 |
Q4 1998 – Q3 2000: only up to Q+4 |
HICP food |
Q4 1998 |
Q1 2024 |
Q4 1998 – Q1 2010: only up to Q+4 |
HICP excluding energy and food |
Q4 1998 |
Q1 2024 |
Q4 1998 – Q1 2010: only up to Q+4 |
Benchmarks |
|||
Consensus Economics |
Q4 2002 |
Q1 2024 |
Complete up to Q+6, partially available for Q+7, and not available for Q+8 Cut-off dates always follow ECB/Eurosystem staff projections cut-off dates |
Market-based |
Q1 2005 |
Q1 2024 |
From Q1 2005 to Q2 2018, based on interpolation between ILS rates Cut-off dates at ECB/Eurosystem staff projections cut-off dates |
Sources: ECB/Eurosystem staff projections, Consensus Economics and ECB staff calculations.
For the two benchmarks, some caveats need to be noted when making comparisons with the ECB/Eurosystem staff projections. The cut-off dates of the monthly forecasts from Consensus Economics are always more recent than those of the ECB/Eurosystem staff projections, potentially offering a slight informational advantage to the former, while, for market-based forecasts, ILS and inflation fixings are collected at the ECB/Eurosystem staff projections cut-off dates, where available. In addition, since inflation fixings are not available prior to September 2018, market-based inflation projections are computed using ILS rates starting at the one-year maturity and shorter maturities are then interpolated from the one-year maturity and realised values. Consequently, short-horizon market-based inferred projections should be treated with caution.
Headline HICP inflation projection accuracy
Compared with real-time out-of-sample forecasts of survey and market-based benchmarks, ECB/Eurosystem staff projections perform either similarly or better, with some exceptions. Survey and market-based approaches provide real-time forecasts, although the information set used by the forecasters might differ from that used by ECB/Eurosystem staff owing to slightly different cut-off dates. The information set used by these forecasters is probably much richer than any simple model-based benchmark and also contains relevant and hard-to-quantify expert judgement, thereby providing a challenging benchmark for ECB/Eurosystem staff projections. Nevertheless, inflation projections of ECB/Eurosystem staff are in most cases either as accurate or more accurate than these benchmarks (Table 2), with the relative RMSEs being close to or higher than unity in several cases. However, ECB/Eurosystem staff projections are found to underperform market forecasts at short horizons. This underperformance mainly reflects the lower relative accuracy of ECB/Eurosystem staff projections over the recent high inflation period. Excluding the latter, ECB/Eurosystem staff projections tend to outperform both survey and market-based projections.[11] Moreover, using the standard RMSE decomposition into the bias and variance of forecast errors, ILS-based short-term inflation forecasts are found to be more biased than equivalent ECB/Eurosystem staff projections, although these ILS-based forecasts outperform the latter. This indicates that the relative underperformance of the ECB/Eurosystem staff short-term projections is driven by a higher forecast error variance, probably reflecting a more rigid forecast than the ILS-based ones. Nevertheless, the results for short-term ILS-based forecasts should be treated with caution, given that up to 2018 the projections from Q+0 to Q+3 are constructed on the basis of interpolations of inflation-linked swaps at one-year maturity and realised inflation.
Table 2
RMSEs of other forecasts relative to ECB/Eurosystem staff projections
Q+0 |
Q+1 |
Q+2 |
Q+3 |
Q+4 |
Q+5 |
Q+6 |
Q+7 |
Q+8 |
||
|---|---|---|---|---|---|---|---|---|---|---|
Whole sample |
Inflation-linked financial products* |
1.32 |
0.88 |
0.91 |
0.96 |
0.99 |
1.03 |
1.05 |
1.07 |
1.09 |
Consensus Economics** |
0.84 |
0.91 |
0.96 |
0.99 |
1.00 |
1.01 |
1.00 |
0.99 |
- |
|
Up to 2019 |
Inflation-linked financial products* |
2.28 |
1.14 |
0.96 |
0.94 |
0.94 |
1.00 |
1.04 |
1.04 |
1.05 |
Consensus Economics** |
1.01 |
1.03 |
1.02 |
1.01 |
0.98 |
0.98 |
1.01 |
1.02 |
- |
Sources: Consensus Economics and ECB calculations using inflation fixings and inflation-linked swaps.
Notes: All RMSEs are divided by the corresponding RMSE of the ECB/Eurosystem staff projections. Thus a value below 1 indicates that the projections are more accurate than the ECB/Eurosystem staff projections, while a value above 1 indicates the reverse. * The relative RMSEs for the Inflation-linked financial products (ILS and inflation fixings) are based on the HICP excluding tobacco. Furthermore, since the ECB/Eurosystem projections of the latter are available only up to Q+3 horizons and partially at the Q+4 horizon, for missing points we consider the ECB/Eurosystem projection errors for HICP excluding tobacco to be the same as the projection errors for headline inflation. ** For Consensus Economics, forecasts up to the fourth quarter of 2006 are rounded to one decimal place, and the same rounding has been applied to the corresponding ECB/Eurosystem staff projections.
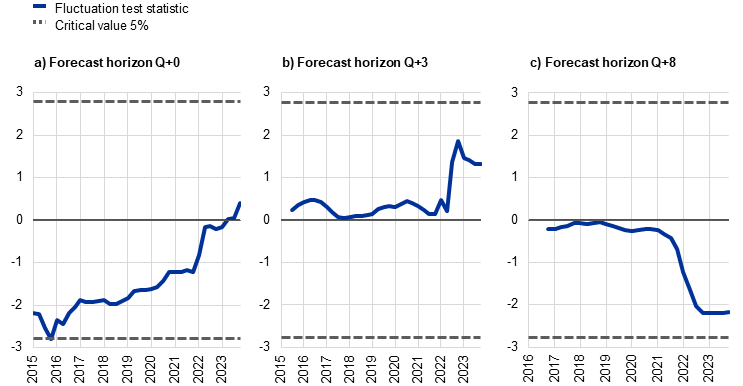
In most cases, the difference in the forecast performance between ECB/Eurosystem staff and both Consensus Economics and markets is statistically insignificant over all horizons and also over time. Differences in forecast performance highlighted in Table 2 are statistically insignificant. Standard Diebold and Mariano tests suggest that the differences in forecast performance at any horizon are not significant at the 5% confidence level. Taking into account potential time variation in the relative forecast performance, the G&R test confirms these results except in the case of market-based nowcasts, which significantly underperform ECB/Eurosystem nowcasts (Chart 2, panel a). Given that the panels for alternative horizons exhibit relatively mild time variation in the loss differentials, and since the G&R test tends to be less powerful with small rolling window sizes in the absence of instabilities, tests were also conducted with large rolling windows. However, these robustness checks with larger windows confirm all the results, pointing to no significant difference in forecast performance.
Chart 2
Relative forecast performance: ECB/Eurosystem staff and market-based forecasts
Sources: ECB/Eurosystem staff projections and ECB calculations.
Notes: Fluctuation test statistics reflect the difference between the MSFE of the ECB/Eurosystem staff projections and that of the market-based forecasts, calculated over 32-quarter rolling windows. Positive (negative) values indicate that the ECB/Eurosystem staff projections underperform (outperform) the market-based forecasts. This underperformance/outperformance is assessed as statistically significant if the test crosses the critical value at the 5% significance level.
Market-based inflation forecasts are based on the HICP excluding tobacco. Since the ECB/Eurosystem projections of the latter are available only up to Q+3 horizons and partially at the Q+4 horizon, missing data points were filled in assuming equal projection errors for headline HICP, HICP excluding tobacco and HICP tobacco.
Role of HICP components and conditioning assumptions
Projection accuracy is broadly similar for headline inflation and its main components, including HICP energy and excluding energy and food inflation, over all forecast horizons. Table 3 shows the RMSEs over the last 12 years for HICP inflation and its main components.[12] Results confirm the strong correlation between the level of volatility in the variables and the RMSEs, with HICP energy exhibiting by far the highest RMSEs and HICPX the lowest. However, volatility-adjusted RMSEs (“rescaled RMSEs”) show a significant reduction in heterogeneity across variables with, for instance, HICP energy forecast accuracy falling within the middle range of the forecast accuracy of other components. Furthermore, HICP energy projections tend to be slightly less accurate than other components over short horizons but more accurate over longer horizons. A slightly different pattern is observed for HCIPX projections, the accuracy of which tends to deteriorate over longer projection horizons relative to, for instance, headline HICP inflation. Importantly, while HICPX projection errors are smaller than those for other HICP components, adjusting for the lower volatility in HICPX realisations reveals projection accuracy similar to other variables overall.
Table 3
RMSEs of HICP inflation and other inflation indicators in ECB/Eurosystem staff projections
RMSE |
Q+0 |
Q+1 |
Q+2 |
Q+3 |
Q+4 |
Q+5 |
Q+6 |
Q+7 |
Q+8 |
|---|---|---|---|---|---|---|---|---|---|
HICP |
0.14 |
0.71 |
1.31 |
1.91 |
2.40 |
2.55 |
2.62 |
2.66 |
2.66 |
HICP food |
0.23 |
0.97 |
1.80 |
2.64 |
3.31 |
3.56 |
3.66 |
3.72 |
3.76 |
HICP energy |
0.92 |
4.56 |
7.96 |
10.66 |
12.58 |
12.72 |
12.51 |
12.35 |
12.23 |
HICP excluding energy and food |
0.07 |
0.33 |
0.59 |
0.89 |
1.18 |
1.29 |
1.38 |
1.45 |
1.49 |
Rescaled RMSE |
Q+0 |
Q+1 |
Q+2 |
Q+3 |
Q+4 |
Q+5 |
Q+6 |
Q+7 |
Q+8 |
HICP |
0.08 |
0.39 |
0.72 |
1.04 |
1.31 |
1.38 |
1.42 |
1.43 |
1.43 |
HICP food |
0.09 |
0.37 |
0.67 |
0.99 |
1.23 |
1.32 |
1.36 |
1.38 |
1.40 |
HICP energy |
0.09 |
0.47 |
0.82 |
1.08 |
1.28 |
1.30 |
1.27 |
1.25 |
1.23 |
HICP excluding energy and food |
0.07 |
0.33 |
0.59 |
0.89 |
1.17 |
1.28 |
1.36 |
1.43 |
1.46 |
Sources: ECB/Eurosystem staff projections and ECB calculations.
Note: All RMSEs are computed over the largest common sample for all variables and forecast horizons (Q2 2012 to Q1 2024).
Adjusting for errors in conditioning variables significantly improves the accuracy of ECB/Eurosystem staff projections, emphasising contributions from errors not only in oil price assumptions but also in other conditioning assumptions. To evaluate the accuracy of the staff projections independently of the errors in some conditioning assumptions which are mostly forecast by markets, RMSEs are also computed for the projections assuming no errors in market-based assumptions and other assumptions described in Section 2. Table 4 shows the RMSEs for the ECB/Eurosystem staff projections of HICP adjusted for different conditioning assumptions. It highlights the significant contribution of errors in oil price assumptions to overall HICP projection errors. Notably, adjusting for errors in the oil price assumption reduces the HICP inflation RMSE by more than 15%, while adjusting for errors in other market-based assumptions, including the effective exchange rate, does not significantly change the level of forecast accuracy over the last 12 years. This analysis does not include adjustments related to errors in gas price assumptions which would trigger a further improvement in projection accuracy, in particular over the post-pandemic period. Moreover, after correcting for errors in other conditioning assumptions, the ECB/Eurosystem staff projections improve further, particularly for longer forecast horizons. This emphasises the role of errors in factors such as foreign demand and prices in domestic inflation projection errors.
Table 4
RMSEs of HICP inflation projections after adjustment for errors in conditioning assumptions relative to unadjusted RMSEs of HICP inflation projections
RMSE adjusted for |
Q+0 |
Q+1 |
Q+2 |
Q+3 |
Q+4 |
Q+5 |
Q+6 |
Q+7 |
Q+8 |
|---|---|---|---|---|---|---|---|---|---|
All assumptions |
0.86 |
0.77 |
0.74 |
0.72 |
0.71 |
0.68 |
0.65 |
0.62 |
0.60 |
All market-based assumptions |
0.88 |
0.81 |
0.80 |
0.79 |
0.80 |
0.80 |
0.81 |
0.81 |
0.81 |
Oil prices |
0.89 |
0.84 |
0.83 |
0.83 |
0.84 |
0.85 |
0.84 |
0.84 |
0.83 |
Nominal exchange rate |
1.00 |
1.00 |
0.99 |
0.99 |
0.99 |
0.99 |
1.00 |
1.00 |
1.00 |
Sources: ECB/Eurosystem staff projections and ECB calculations.
Notes: RMSEs are computed over the largest common sample for all variables and forecast horizons (Q2 2012 to Q1 2024). All RMSEs are divided by the corresponding RMSE of the headline HICP inflation projections. Thus a value below 1 indicates that the projections are more accurate than the unadjusted HICP inflation projections, while a value above 1 indicates the reverse.
3 Further selected properties of ECB/Eurosystem staff inflation projections
Bias and rigidities in ECB/Eurosystem staff headline inflation projections
Detecting potential bias in ECB/Eurosystem projections can help improve their accuracy. A bias indicates whether there is a systematic and persistent over or underprediction of the target variable. Such a bias might, however, not necessarily reflect a lack or misuse of information, as several studies suggest that central bank forecasters have skills and sufficient data to efficiently predict target variables, but it might be optimal for them to make either an optimistic or a pessimistic projection.[13] Nevertheless, identifying bias and its potential sources can improve projection accuracy. By understanding whether forecasts tend to systematically over or underpredict the target variable, the forecasting models or methodologies can be adjusted to compensate for unwarranted bias. This can improve the overall accuracy of future projections. It should also be noted that assessing forecast bias is not straightforward, and it can be argued that unexpected large shocks in one direction, such as the ones seen in 2021-2022, can result in serially correlated forecast errors that do not necessarily reflect a shortcoming of the projection process.
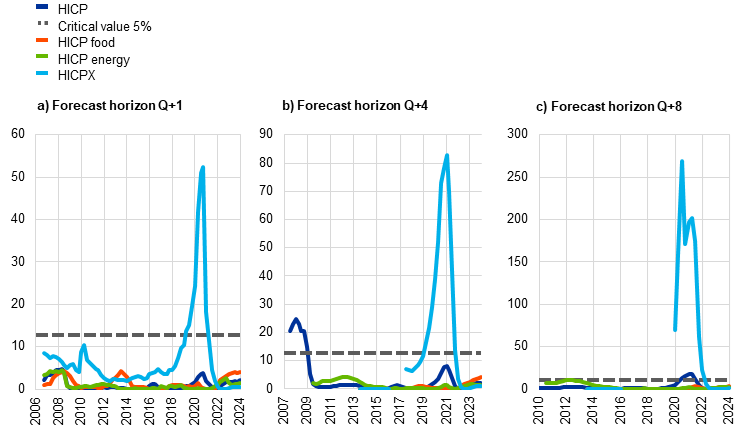
Fluctuation rationality tests indicate that the ECB/Eurosystem staff headline inflation projections are generally unbiased, although there are specific, sometimes short-lived periods in which this unbiasedness breaks down. Rather than assessing forecast bias over the entire available sample, the R&S fluctuation rationality test allows unbiasedness to be checked over smaller windows to prevent offsetting biases over the whole sample. A crucial ingredient in the R&S test is the size of the rolling window. This needs to be large enough, in particular for long horizons. We follow Rossi and Sekhposyan by considering different window sizes (Chart 3). Considering 32-quarter rolling windows, fluctuation rationality tests reject the unbiasedness hypotheses for almost all forecast horizons. Increasing the window slightly to 40 quarters, we find no bias at any horizon.[14] This lack of robustness in the fluctuation rationality tests indicates the presence of specific periods in which the unbiasedness of the ECB/Eurosystem staff headline inflation projections breaks down. Moreover, the R&S fluctuation rationality test provides useful information about the timings of the departure from unbiasedness. Chart 3 indicates two substantial breakdowns which occur in 2007-2009 and in 2020. This indicates that over the eight years prior to these dates, ECB/Eurosystem staff either consistently underpredicted or consistently overpredicted inflation. Furthermore, if the projection exercises at the very beginning of the sample (up to December 2000) are excluded, projection errors for up to four-quarters-ahead horizons are found to be perfectly unbiased even with small rolling window sizes.
Chart 3
Fluctuation rationality test of bias for HICP headline inflation
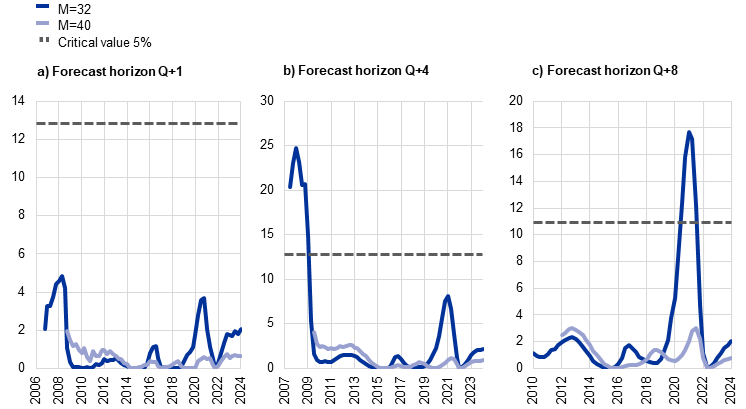
Sources: ECB/Eurosystem staff projections and ECB calculations.
Notes: The y-axis corresponds to the value of the Wald statistic of the test with 32-quarter (M=32, blue line) and 40-quarter (M=40, grey line) rolling windows. The x-axis corresponds to the date of the last data point of the rolling window. For example, the peak of the results for the fluctuation rationality test in the first quarter of 2021 for a 32-quarter rolling window refers to the results for the period from the second quarter of 2013 to the first quarter of 2021. The null hypothesis of the absence of unbiasedness is rejected if the Wald statistic crosses the critical value at the 5% level (dashed grey line). Although critical values vary with the length of the rolling window, they are generally similar. For simplicity, we plot only the critical value at the 5% level for a 32-quarter window.
This occasional bias in HICP projections might in part reflect some rigidities in headline inflation projections, in particular for short horizons.[15] The presence of persistent forecast errors might indicate that new information made available between two projection rounds is not properly accounted for in the forecast revisions.[16] To check for this, an oversmoothing test was conducted to assess whether ECB/Eurosystem staff forecasts tend to adapt too smoothly to macroeconomic shocks and to underreact to new information (see mathematical details of the test in Box 1). The results confirm the presence of such rigidities in ECB/Eurosystem projections for up to three-quarters-ahead horizons, but does not reject the absence of excessive sluggishness for longer horizons (Chart 4).[17] This result is also supported by serial correlation tests, which exhibit autocorrelations in the forecast errors of an order strictly below the corresponding forecast horizon except for horizons up to two quarters ahead, thus violating one of the forecast optimality conditions.[18] It should be noted, however, that in periods of strong shocks in one direction it may be difficult to disentangle whether this outcome is due to sluggishness of the projections or to unexpectedly autocorrelated shocks. In fact, the oversmoothing property tends to weaken when adding information on conditioning assumptions (see below).
Chart 4
Fluctuation rationality test of oversmoothing for HICP
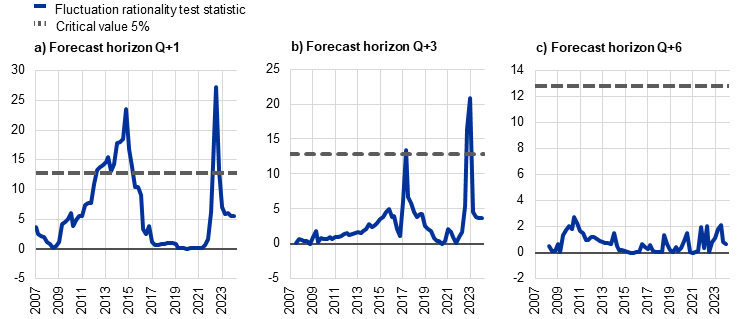
Sources: ECB/Eurosystem staff projections and ECB calculations.
Notes: The y-axis corresponds to the value of the Wald statistic of the test with a 32-quarter rolling window. The x-axis corresponds to the date of the last data point of the rolling window. For example, the peak of the results for the fluctuation rationality test in the second quarter of 2022 (panel a) refers to the results for the period from the third quarter of 2014 to the second quarter of 2022. The null hypothesis of the absence of oversmoothing is rejected if the Wald statistic crosses the critical value at the 5% level (dashed grey line). Results for medium-term projections (more than three-quarters-ahead horizons) do not reject the hypothesis of absence of oversmoothing, as illustrated by the Q+6 results.
Role of HICP components and conditioning assumptions
At the HICP component level, prolonged episodes of bias and rigidities in HICP excluding energy and food inflation seem to drive similar properties in headline inflation. Looking at HICP components, results hint at a prolonged departure from the unbiasedness hypothesis in HICPX inflation projections for all horizons (Chart 5).[19] However, results at horizons above Q+3 should be treated with caution given the relatively small HICPX projection error sample available. Nevertheless, over these samples, which account for 48 to 58 data points depending on the forecast horizon, the sign of forecast errors changed only three times at the Q+4 horizon and only twice at longer horizons, which clearly indicates the presence of bias (see Chart 6).[20] In particular, from 2013 to the first half of 2021, when inflation was low, ECB/Eurosystem staff projections of HICPX inflation consistently overestimated actual inflation. The bias in HICPX projections may also reflect some rigidities, as HICPX inflation exhibits oversmoothing for most forecast horizons and in particular for short horizons, indicating that forecast revisions underreact to new information between projection rounds. Turning to HICP energy projections, these were found to be unbiased at all horizons up to five quarters ahead, but the unbiasedness hypothesis was systematically rejected for longer horizons.[21] Since ECB/Eurosystem staff projections of energy inflation are more sensitive than other HICP components to market conditioning assumptions, this result probably reflects bias in the oil price futures for long horizons owing to, among other factors, storage costs.
Chart 5
Fluctuation rationality test of bias for HICP and its main components
Sources: ECB/Eurosystem staff projections and ECB calculations.
Notes: The y-axis corresponds to the value of the Wald statistic of the test with a 32-quarter rolling window. The x-axis corresponds to the date of the last data point of the rolling window. For example, the peak of the results for the fluctuation rationality test for HICPX inflation in the first quarter of 2021 refers to the results for the period from the second quarter of 2013 to the first quarter of 2021. The null hypothesis of unbiasedness is rejected if the Wald statistic crosses the critical value at the 5% level (dashed grey line). Although critical values vary with sample size, which differs among variables, they are generally similar. For simplicity, we plot only the critical value at the 5% level for headline HICP inflation.
Chart 6
HICPX inflation and ECB/Eurosystem projection errors for HICPX inflation at horizons Q+0 to Q+8
(annual percentage changes; percentage point errors, quarterly data)
Sources: ECB/Eurosystem staff projections and ECB calculations.
Notes: The blue line indicates the realisations of year-on-year (y-o-y) HICPX in percentages. The various grey lines illustrate ECB/Eurosystem staff HICPX projection errors in percentage points, defined as realised y-o-y HICPX inflation minus the corresponding projection at various horizons from Q+0 (lightest grey) to Q+8 (darkest grey). The grey shaded area encompasses the entire range of these projection errors across the different time horizons.
Some bias and rigidities in ECB/Eurosystem staff inflation projections disappear after adjusting for errors in some conditioning assumptions. Using conservative assumptions with a rolling window of eight years, we previously identified a bias for headline inflation across all horizons starting from Q+2. After correcting for the impact of all available assumptions, a bias is identified only for nowcasts and for projections longer than Q+6 (Table 5). However, when adjusting for market-based assumptions only, the bias persists at the Q+4 and subsequent horizons, indicating that other conditioning assumptions, such as those stemming from the international environment, are mainly responsible for the bias, in particular during the period before the pandemic crisis. Similar conclusions can be drawn when looking at projection rigidities. After adjusting for all available assumptions, rigidities disappear in HICP projections at the Q+2 and subsequent horizons, while after correcting only for errors in all market-based assumptions, tests still reject the null hypothesis of the absence of oversmoothing at the Q+3 and Q+4 horizons. This suggests that the other conditioning assumptions might also suffer some rigidities. However, these results, including the absence of oversmoothing at longer horizons, must be treated with caution given the relatively short sample available, in particular for long-term projections. In addition, given the unprecedented shocks of the pandemic and Russia’s war in Ukraine, which could not be predicted very far in advance, it is necessary to exercise caution in interpreting the results, as such events can generate autocorrelations in forecast errors which do not necessarily arise from inefficient use of information.
Table 5
Fluctuation rationality tests for headline inflation adjusted for various errors in conditioning assumptions
Null hypothesis |
Adjusted for |
Q+0 |
Q+1 |
Q+2 |
Q+3 |
Q+4 |
Q+5 |
Q+6 |
Q+7 |
Q+8 |
|
|---|---|---|---|---|---|---|---|---|---|---|---|
Unbiasedness |
None |
- |
- |
** |
*** |
*** |
*** |
*** |
*** |
*** |
|
All assumptions |
*** |
- |
- |
- |
- |
- |
- |
** |
*** |
||
All market-based assumptions |
- |
- |
- |
- |
** |
*** |
*** |
*** |
*** |
||
Oil prices |
- |
- |
- |
- |
* |
** |
*** |
*** |
*** |
||
Nominal exchange rate |
- |
- |
- |
- |
- |
- |
- |
* |
** |
||
Absence of oversmoothing |
None |
*** |
*** |
*** |
*** |
* |
- |
- |
- |
||
All assumptions |
*** |
** |
- |
- |
- |
- |
- |
- |
|||
All market-based assumptions |
*** |
*** |
*** |
*** |
- |
- |
- |
- |
|||
Oil prices |
*** |
*** |
*** |
*** |
- |
- |
- |
- |
|||
Nominal exchange rate |
*** |
*** |
*** |
*** |
*** |
** |
- |
- |
|||
Notes: A dash (-) indicates that the null hypothesis is not rejected. One asterisk (*) signifies rejection at the 10% level, two asterisks (**) at the 5% level, and three asterisks (***) at the 1% level. Fluctuation rationality tests calculated over 32-quarter rolling windows.
4 Conclusion
This article suggests that the accuracy of Eurosystem/ECB staff projections of headline HICP inflation is either similar to or slightly better than that of market and survey-based forecasts and is also similar across main HICP components. Inflation projections by ECB/Eurosystem staff perform broadly similarly to market and survey-based forecasts, although the latter tend in general to slightly underperform ECB/Eurosystem staff projections, in particular prior to the unprecedented pandemic and post-pandemic shocks. Furthermore, and across HICP components, results show that, over the last 12 years, the accuracy of ECB/Eurosystem staff projections of HICPX inflation was similar to that of the projections of headline inflation and HICP energy inflation, although the latter show larger projection errors, largely reflecting the higher volatility of these variables.
Although unbiased overall, results show specific periods in which the unbiasedness of ECB/Eurosystem staff inflation projections breaks down, while the projections also exhibit rigidities, mainly reflecting the properties of HICPX inflation projections in the decade before 2020. While they are unbiased overall, ECB/Eurosystem staff projections of headline HICP inflation show some bias in specific periods, such as in early 2000 and when inflation was low from 2013 to the first half of 2021. The findings also highlight that, when considering the entire sample, there seems to be no bias in HICPX inflation projections. However, examining shorter periods reveals a negative bias (overestimation) during the low-inflation period before the pandemic and a positive bias (underestimation) during the high-inflation period which followed. Therefore, these findings should not be seen as proof of a consistent bias in HICPX projections.
Finally, this article underscores the important role of the broad set of conditioning assumptions as key contributors to the rigidities, occasional bias and reduced accuracy of ECB/Eurosystem staff projections of HICP inflation. The results confirm the role of errors in oil price assumptions in reducing ECB/Eurosystem staff inflation forecast accuracy. They also highlight their contribution to some bias in headline HICP projections, notably for the short term.[22] However, the results also underline the role of other conditioning assumptions, such as those stemming from the international environment, in reducing forecast accuracy and also explaining some of the rigidities and occasional bias in headline inflation projections. It is also important to mention that gas prices have not been considered in the analysis, although they have played a key role in forecast errors in the recent period.